Category Archives: PhD related

The Who dimension

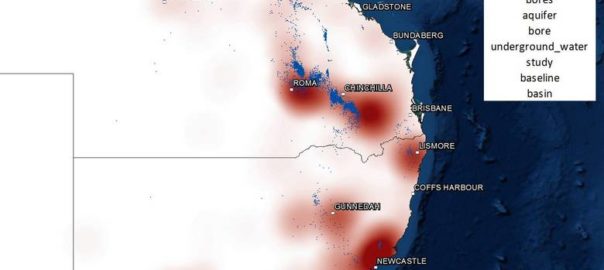
My last post focussed on my progress in making sense of the Where dimension of the public discourse on coal seam gas, including how the Where intersects with the What. This post is about the Who. Somehow, I’ve managed to say almost nothing on this blog so far about the Who dimension of my data. Nearly all of what I’ve written has been about the What, Where and When. It’s time to rebalance this equation.

Until recently, the Who dimension of my data was represented only by a pool of Australian news organisations (at more than 300 sources, it was admittedly a rather large pool), as I was working just with the data I retrieved from the Factiva news database. Now that I have incorporated additional data that I scraped from the websites of community, governments and industry stakeholders (as discussed in my last post), the Who dimension has become a little bit richer. Before I start exploring questions about specific stakeholders and news organisations, or make decisions about which sources I might want to exclude all together, I want to survey the full breadth of sources in my data. I want the birds-eye view. But how to get it?

Who × When ÷ Where = Wha…?

In the previous post, I listed all of my stakeholder sources in colourful tables showing the production of content over time. Initially I thought that doing the same thing with 300 news sources would be ridiculous, but then I figured it might just be ridiculous enough to work. Through a creative deployment of Excel’s conditional formatting feature, I managed to make what you see in Figure 1. Each horizontal band is an individual news source, and the darkness of the band corresponds with the number of articles produced by that source per quarter. Within each state, the sources are grouped by region, although I haven’t indicated where these groupings begin and end (maybe next time!).

Figure 1. The temporal coverage of all news sources in my corpus.
Figure 1. The temporal coverage of all news sources in my corpus. Each horizontal band represents a news source, while the shading indicates the number of articles published per quarter.

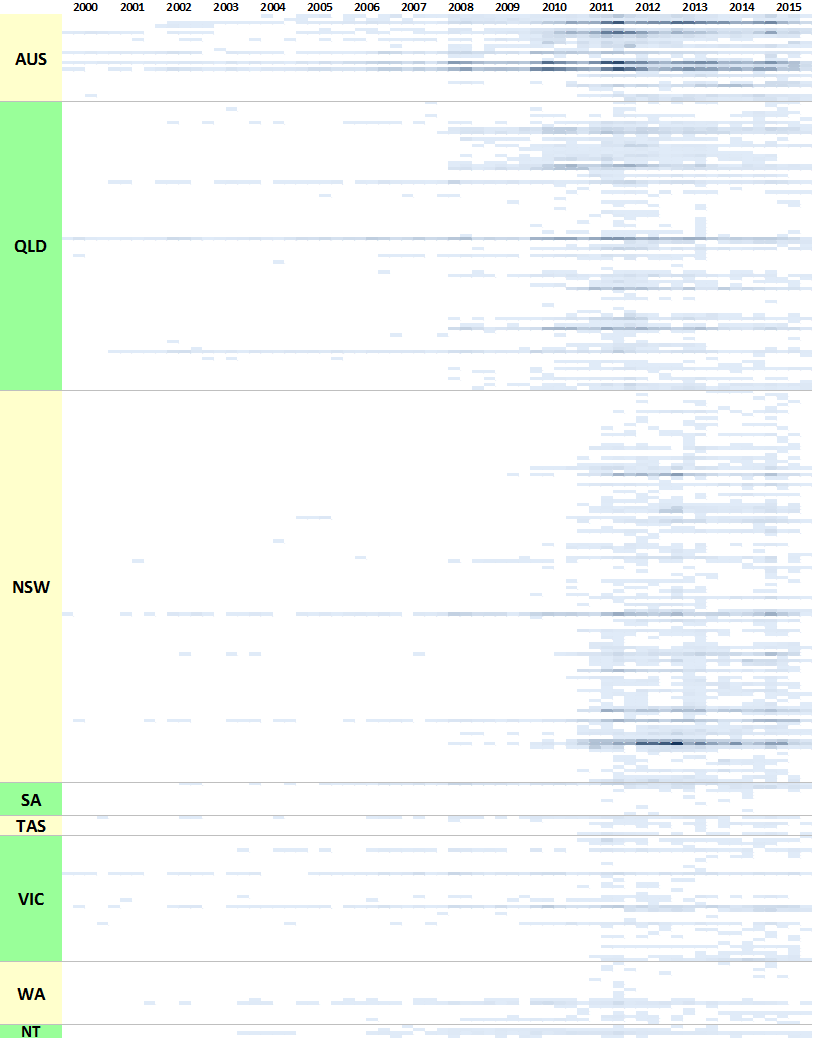
For an experiment that I didn’t take very seriously, this viz actually isn’t too bad. It highlights several features of the data that are useful to know. Firstly, it shows that very few publications have been reporting on coal seam gas continuously since 2000. Nationally, there are The Australian, The Financial Review, Australian Associated Press, and Reuters News (these are not labelled on the graph, so you’ll have to take my word for it). In Queensland, there are the Courier-Mail, the Gold Coast Bulletin, and (to a lesser extent) the Townsville Bulletin. In New South Wales, there has been more-or-less continuous coverage from the Sydney Morning Herald, and somewhat patchier coverage from the Newcastle Herald. The long horizontal lines in Victorian part of the chart represent the Herald Sun and The Age. Continue reading The Who dimension

Where are we now?

It’s been a busy few months. Among other things, I presented at the Advances in Visual Methods for Linguistics 2016 conference held here in Brisbane last week; I submitted a paper to the Social Informatics (SocInfo) 2016 conference being held in Seattle in November; and I delivered a guest lecture to a sociology class at UQ. Somewhere along the way, I also passed my mid-candidature review milestone.

Partly because of these events, and partly in spite of them, I’ve also made good progress in the analysis of my data. In fact, I’m more or less ready to draw a line under this phase of experimental exploration and move onto the next phase of fashioning some or all of the results into a thesis.

With that in mind, I hope to do two things with this post. Firstly, I want to share some of my outputs from the last few months; and secondly, I want to take stock of these and other outputs in preparation for the phase that lies ahead. I won’t try to cram everything into this post. Rather, I’ll focus on just a few recent developments here and aim to talk about the rest in a follow-up post. Specifically, this post covers three things: the augmentation of my dataset, the introduction of heatmaps to my geovisualisations, and the association of locations with thematic content. Continue reading Where are we now?

Playing with page numbers

When was the last time you read a newspaper? I mean an actual, physical newspaper? Can you look at your fingertips and picture them smudged with ink, or remember trying to turn and fold those large and unwieldy pages? These are fading memories for me, and are probably totally foreign to many younger people today. Like many people, I consume virtually all of my news these days via the internet or, on rare occasion, the television. As far as I am concerned, newspapers are fast becoming nothing more than historical artifacts.

And yet, newspaper articles account for the bulk of the news data that I am analysing in my PhD project. To be sure, most of these newspaper articles were also published online, and would have been consumed that way by a lot of people. But I feel I can’t ignore the fact that these articles were also produced and consumed in a physical format. Unfortunately, there’s not much I can do to account for the physical presentation of the articles. My database doesn’t include the accompanying images or captions. Nor does it record how the articles were laid out on the page, or what other content surrounded them. But the metadata provided by Factiva does include one piece of information about each article’s physical manifestation: the page number of the newspaper in which it appeared.

From the very beginning of the explorations documented on this blog, I have completely ignored the page number field in my dataset. I figured that I was analysing text, not newspapers, and in any case I couldn’t see how I would incorporate page numbers into the kind of analysis that I was planning to do. But after hearing a colleague remark that ‘article-counting studies’ like mine are often unsatisfactory precisely because they fail to account for this information, I decided to give it some more thought. Continue reading Playing with page numbers

Looking for letters

In the posts I’ve written to date, I’ve learned some interesting things about my corpus of 40,000 news articles. I’ve seen how the articles are distributed over time and space. I’ve seen the locations they talk about, and how this shifts over time. And I’ve created a thematic index to see what it’s all about. But I’ve barely said anything about the articles themselves. I’ve written nothing, for example, about how they vary in their format, style, and purpose.

To some extent, such concerns are of secondary importance to me, since they are not very accessible to the methods I am employing, and (not coincidentally) are not central to the questions I will be investigating, which relate more to the thematic and conceptual aspects of the text. But even if these things are not the objects of my analysis, they are still important because they define what my corpus actually is. To ignore these things would be like surveying a large sample of people without recording what population or cohort those people represent. As with a survey, the conclusions I draw from my textual analysis will have no real-world validity unless I know what kinds of things in the real world my data represent.

In this post, I’m going to start paying attention to such things. But I’m not about to provide a comprehensive survey of the types of articles in my corpus. Instead I will focus on just one categorical distinction — that between in-house content generated by journalists and staff writers, and contributed or curated content in the form of readers’ letters and comments. Months ago, when I first started looking at the articles in my corpus, I realised that many of the articles are not news stories at all, but are collections of letters, text messages or Facebook posts submitted by readers. I wondered if perhaps this reader-submitted content should be kept separate from the in-house content, since it represents a different ‘voice’ to that of the newspapers themselves. Or then again, maybe reader’s views can be considered just as much a part of a newspaper’s voice as the rest of the content, since ultimately it is all vetted and curated by the newspaper’s editors.

As usual, the relevance of this distinction will depend on what questions I want to ask, and what theoretical frameworks I employ to answer them. But there is also a practical consideration — namely, can I even separate these types of content without sacrificing too much of my time or sanity? 40,000 documents is a large haystack in which to search for needles. Although there is some metadata in my corpus inherited from the Factiva search (source publication, author, etc.), none of it is very useful for distinguishing letters from other articles. To identify the letters, then, I was going to have to use information within the text itself. Continue reading Looking for letters