Category Archives: PhD related

What’s it all about? Indexing my corpus using LDA.

Months ago, I assembled a dataset containing around 40,000 Australian news articles discussing coal seam gas. My ultimate aim is to analyse these articles, along with other text data from the web, so as to learn something about the structure and dynamics of the public discourse about coal seam gas in Australia. I’m interested in dissecting how different parties talk about this topic, and how this ‘configuration’ of the public discourse changes over time.

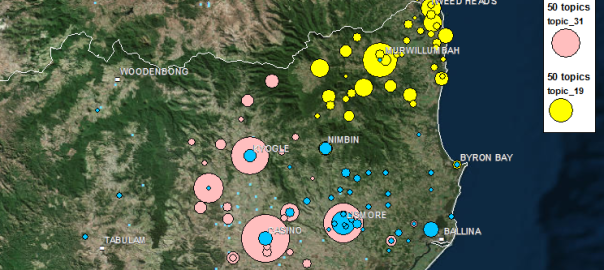
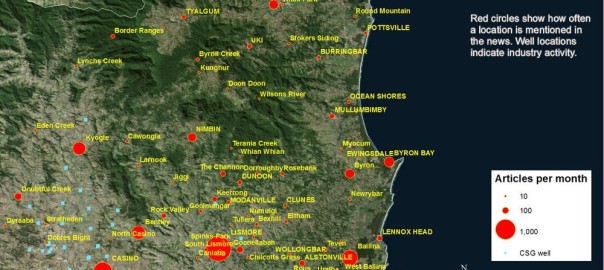
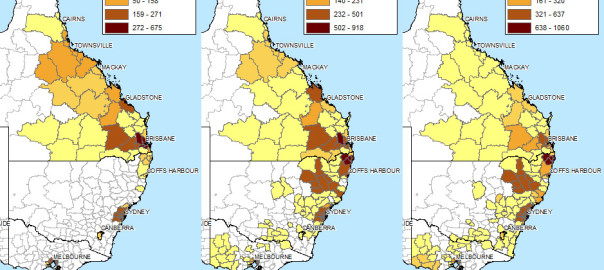
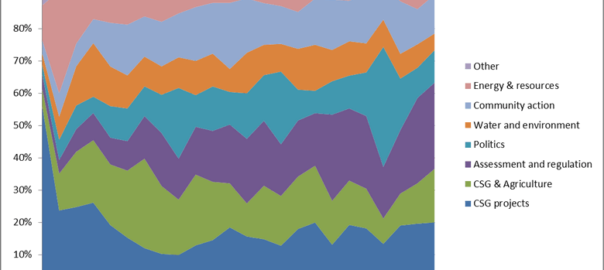
Although I didn’t originally plan to, I’ve focussed much of my energy so far on exploring the geographic dimension of the news articles. I’ve looked at where the news has come from and what places it talks about. This is all important stuff to know when studying such a geographically defined issue as coal seam gas development. But I also need to know what is being talked about, not just where. Now, finally, I am ready to turn my attention to exploring the thematic content of the articles.

Well, almost. I’m ready, but the data isn’t. The dataset that I have been playing with all this time is stuffed with articles that I don’t want, and is missing many that I do. This is because the search parameters that I used to retrieve the articles from Factiva were very broad — I obtained every article that mentioned coal seam gas or CSG anywhere even just once — and because I applied a rather rudimentary method — keyword counts — for filtering out the less relevant articles. The dataset has served its purpose as a testing ground, but if I am to use it to actually say things about the world, I need to know what it contains. And more than that, I need the ability to customise what it contains to suit the specific questions that I decide to explore.

In other words, I need an index to my corpus. I need to know what every article is about, so I can include or exclude it at my discretion. In this post I’ll describe how I have created that index using a method of topic modelling called Latent Dirichlet Allocation, or LDA. Happily, this is the very same method that I was planning to use to analyse the thematic content of my corpus. So by creating an index for my corpus, I am already starting on the process of understanding what it’s all about. Continue reading What’s it all about? Indexing my corpus using LDA.

What do you do with a thousand place names?


My previous post was all about turning place names in news articles into dots on a map. Using a fairly straightforward method, I matched the place names in a collection of 26,863 news articles against the names and geographic coordinates in the Australian Gazetteer 2012, which lists and locates virtually every named place in Australia. Using such a comprehensive list created a fair amount of extra work, but resulted in a very rich and satisfying visualisation of how the news coverage about coal seam gas has moved over time. Ultimately however, I want to translate these rich visualisations into simpler narratives and numerical descriptions. And to do this, individual statistics for every one of the 1,448 places on my list will not be of much help. I will need some way of aggregating the locations into relevant regions or locales.

To achieve this, one could perhaps use some technique to group the locations based on spatial proximity — something akin to drawing fences around the places that form discrete clusters on the map. But there might be reasons besides proximity to group places together. Spatially distinct places might be united by common issues or events, just as proximate places might be subject to separate laws and controversies. Given that my ultimate object of study is public discourse, such non-geographical unifying factors may prove to be as important as geographical ones.

Latent Deary What?

Only some of these thoughts had crossed my mind when the idea hit me to use a topic modelling technique called Latent Dirichlet Allocation (LDA) to bring some order to my large list of locations. LDA is a technique that automatically identifies topics in large collections of documents, with a ‘topic’ in this context being defined as a set of words that tend to occur together in the documents that you are analysing. LDA uses some clever assumptions and iterative processes to find sets of words that, in most cases at least, correspond remarkably well with meaningful topics in the text. It is widely used for automated document categorisation and indexing, and more recently it has been applied to fields such as history and literary studies under the banner of the digital humanities. If you’re fluent in hieroglyphics, the Wikipedia page might be a good place to start if you want to know more about LDA. If you’re a mere mortal, pages like this one and this one offer a softer introduction.

Like many computational text analysis methods, LDA views each document as an unordered ‘bag of words’. (This might sound like the surest way to render a document meaningless, but the payoff is that it makes the text amenable to all kinds of statistical techniques.) So I figured, why not instead feed the LDA algorithm bags of places, which is exactly what I had created from my collection of news articles when preparing my last post. I saw no reason why LDA couldn’t turn this data into groups of locations that were both spatially and discursively meaningful. Places that are mentioned together in articles are likely to be physically close to one another, linked by social context, or most likely, both. Meaningful groupings of these places could be called geographic topics, or geotopics for short. Continue reading What do you do with a thousand place names?

How the news moves


Don’t feel like reading? Fine, skip to the pictures!

My last post explored the spatial and temporal dynamics of news production, looking at how the intensity of news coverage about coal seam gas varied over time across regional newspapers. In this post, I will look instead at the geographic content of news coverage: which places do news articles about coal seam gas discuss, and how has the geographic focus changed over time?

Coal seam gas development in Australia has become a matter of national interest, at least insofar as it has a place (albeit a shrinking one) on the federal political agenda, and has featured (albeit to varying degrees) in news coverage and public debate across the country. But it’s hard to talk sensibly about coal seam gas — whether you are talking about the industry itself, its social and environmental impacts, or how the community has responded to it —  without grounding the discussion in specific locations. From one gas field to another, the structures and dynamics of underground systems vary just as much as the social systems on the surface. I am convinced that any meaningful analysis of CSG-related matters must be highly sensitive to geographic context. (My very first PhD-related post on this blog, an analysis of hyperlinks on CSG-related web pages, pointed to the same conclusion.)

Most news stories about coal seam gas are ultimately about some place or another (or several), whether it be the field where the gas is produced, the power plant where it is used, the port from which it is exported, the environment or community affected, or the place where people gather to protest or blockade. Keeping track of which places are mentioned in the news could provide one way of tracking how the public discourse about coal seam gas develops. And the most logical way to present and explore this kind of information is with a map. In theory, every place mentioned in an article could be translated to a dot on a map. Mapping all of the dots from all of the articles should reveal the geographical extent and focus of news about coal seam gas.

Why do this? (Other than because I can, and it might be fun?) Firstly, because I’m still a little sketchy about how coal seam gas development and its attendant controversies have moved around the country over the last decade or two. I’m reasonably familiar with what has transpired in Queensland, but much less so with the situation in New South Wales. As for the other states, where there has been much less industry activity, I know virtually nothing about where and when coal seam gas has been discussed. So a map (especially one that can show time as well) of CSG-related news would provide a handy reference for understanding both the national and local geographic dimensions of the issue.

The other reason to map the news in this manner is that it may provide a way to both generate and answer interesting questions about the news landscape (or the public discourse more broadly) around coal seam gas — and this is, after all, what my PhD needs to do. Continue reading How the news moves

Mapping the news

Where did the last 12 months go? All I can really remember is something about being confirmed as a PhD candidate. I read a lot, and wrote a lot, but did very little of what I originally set out to do — namely, visualising and analysing text data. Now, finally, I am back in the sandpit. I’ve amassed a truckload of data in the form of news articles and blogs about coal seam gas development in Australia, and I intend to spend the next short while sifting through it and seeing what sort of sandcastles I can build before the tide of my next PhD milestone forces me to construct something more substantial.

The ultimate aim of my PhD is to explore how computational text analysis techniques such as topic modelling can assist in the analysis of public discourse. But for now, my objective is to get acquainted with my data. This data is divided into two piles, each representing a part of the discursive landscape around coal seam gas (or CSG) in Australia (if you’re American, think coalbed methane). One pile of data consists of texts published on the web by a range of actors (the sociology kind, not the Hollywood kind) including community groups, activists, lobbyists and politicians. I’ve siphoned these texts from a variety of websites using a data-crawling tool called import.io. The second, much larger, pile of data consists of news articles from hundreds of Australian mainstream media publications, from the national broadsheet right down to the local rags. I gathered these articles from the online news database Factiva, with the help of a script, available at the website for the conversation analysis tool Discursis, which converts Factiva’s HTML outputs into tabular format in the form of CSV files.

This post is devoted to exploring the second pile of data — the many thousands of news articles that I gathered from Factiva. Without attempting any fancy text analysis, I aim to get a first look at the overall volume, scope and diversity of the content. The focus in this post is on the overall volume and the geographic distribution of the content. In a future post, I plan to explore the the specific news sources in more detail. Continue reading Mapping the news