A Covid case number junkie
It’s been part of my routine for several weeks now. Almost like clockwork, at around 8:30am, my phone buzzes. I hold my breath, partly avert my gaze, and unfold the notification just far enough to see the familiar sentence: “Victoria has recorded…”
What comes next can set the tone for the whole day. If the number of new Covid-19 cases recorded in the preceding 24 hours is smaller than the number reported the day before, I breathe a sigh of relief and ease into the day as if a small weight has lifted. If the number has gone up, I slap down my phone in disappointment and try — usually without success — to console myself with the idea that it is probably just a blip that will be corrected with a lower number tomorrow.
I’m sure that the story is similar for many Victorians. It could hardly be otherwise, given that these daily case numbers are now our ticket to freedom, as laid out in the state’s Roadmap to Covid-normality. If the case numbers stay low until September 28 — or more specifically, if the 14-day average at that point is less than 50 — Dan Andrews will let Melbourne residents socialise with up to five people from two households. Luxury! If we get the average down to below five by 26 October, we’ll almost be allowed to behave like human beings again. Under the current framework, our only way out of lockdown is through the numbers.
Given that the only numbers that really matter according to the roadmap are fortnightly averages, it makes little sense to get worked up about the number of cases announced on any given day. Probably we’d all be better off ignoring the daily announcements and getting weekly summaries instead. But I, for one, am not about to kick the habit. As long as that magic number is reported each day, I am going to keep getting my fix and reading into it as much as I can.
Weekly Covid cycles
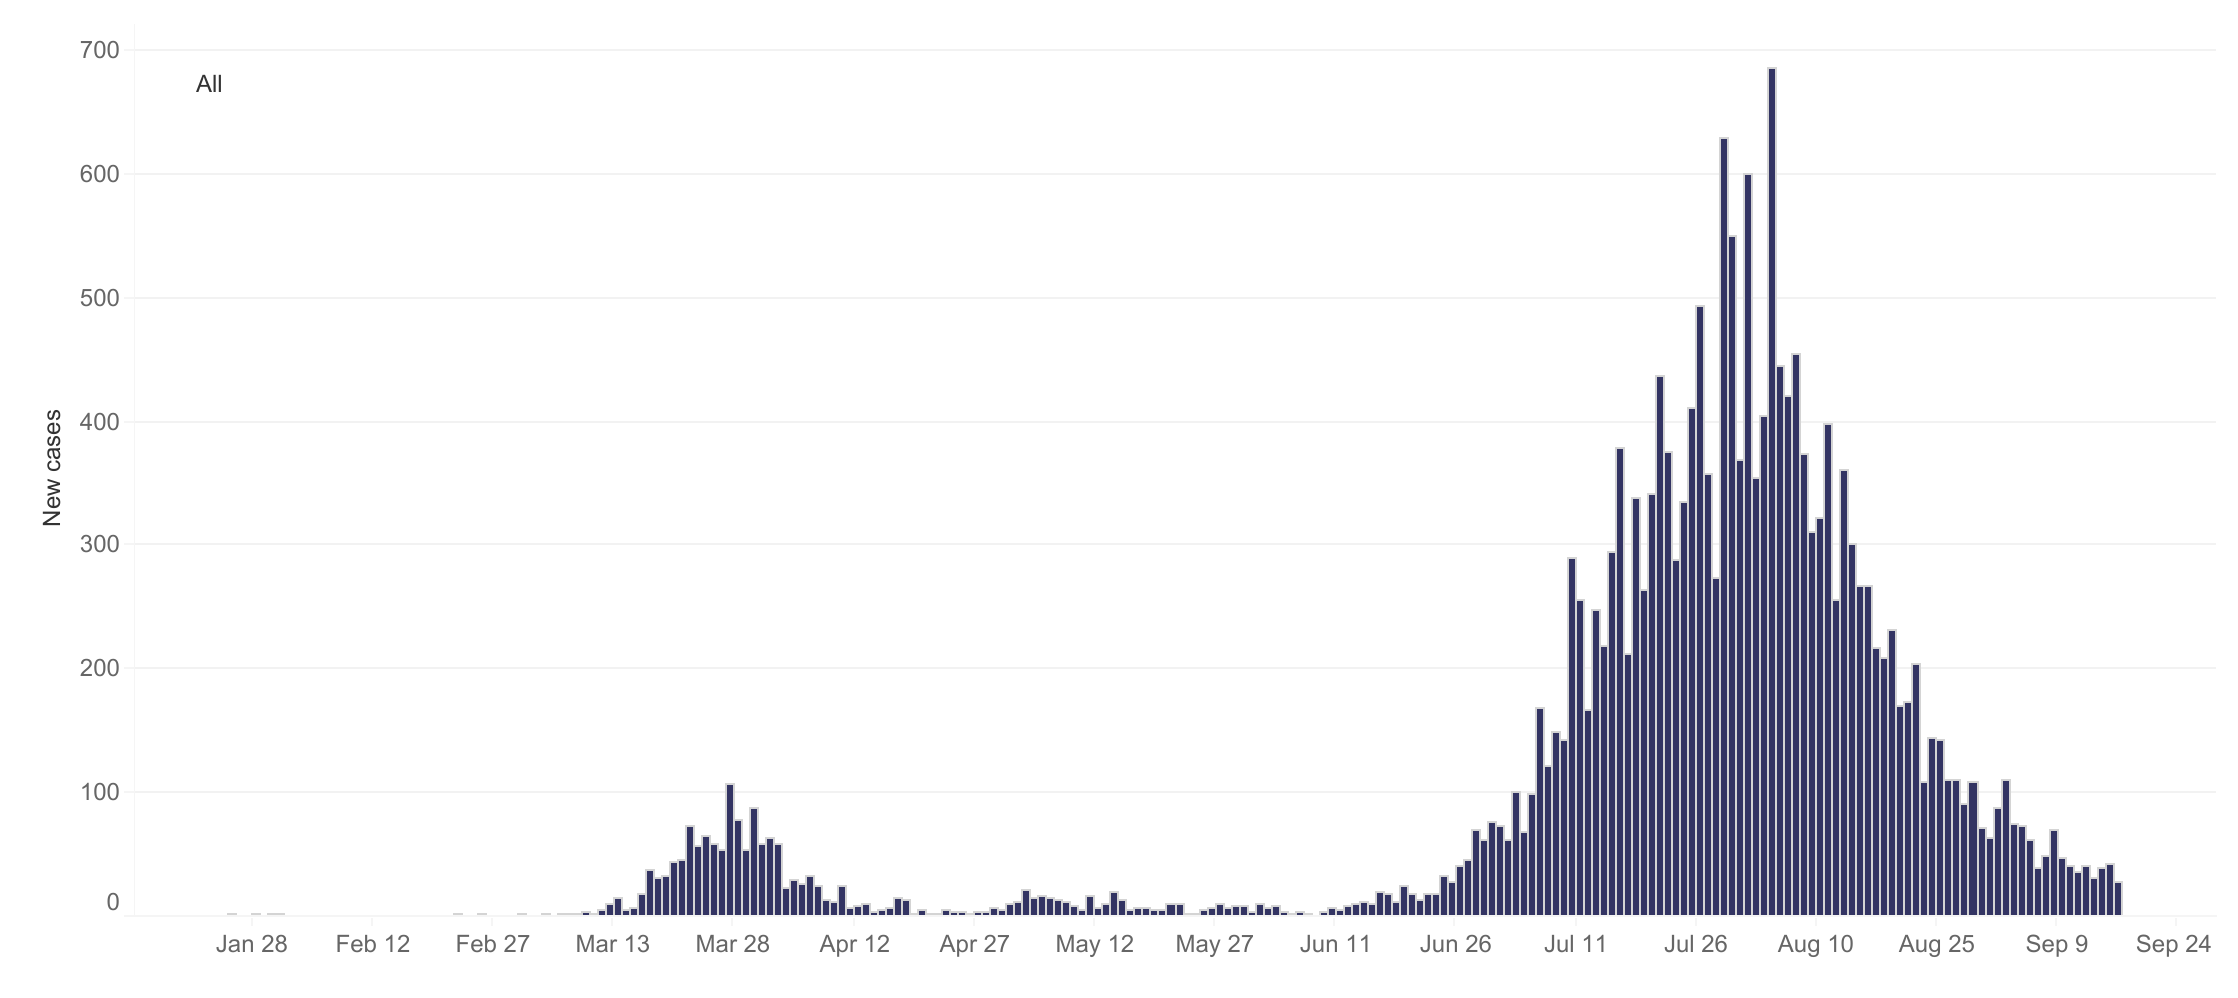
One thing that has become apparent to case number junkies like me is that not every day of the week is equal. On average, certain days of the week tend tend to have higher case numbers than others. You can see this most clearly in the global total, as in the version reproduced below from Our World in Data. Nested within the larger wave of cases is a recurring ripple of a week’s duration.
Surprisingly, there is no consensus yet about why this weekly cycle occurs. The handful of research papers that I have found about the topic all confirm that weekly cycles in cases and deaths are real, but offer contrasting explanations. One paper examining data specific to the US concluded that most of the weekly variations could be explained by quirks in reporting regimes and fluctuations in testing activity. Other studies, especially those looking at countries other than the US, have argued against this explanation and suggested alternative causes. Noting that new cases in several countries tend to peak on Thursdays or Fridays and then fall on weekends, one paper hypothesises that infections rise when the stress of the working week compromises the immune system. Another paper explains the same pattern by suggesting that weekends provide more opportunities for young people to mingle with their elders, thus causing infections that will become symptomatic five days later (i.e. on Thursday or Friday) and leading to deaths about 14 days after symptoms emerge. Yet another paper hypothesises that cycles in air pollution (caused by traffic, for example) or the bodies own circadian rhythms could play a role.
This kind of weekly oscillation has not been as obviously apparent in Australian case numbers, largely because the numbers have been so low to begin with. When cases did get out of control in Victoria a couple of months ago, the Stage 4 lockdown measures introduced in early August turned the numbers around so quickly that there has never been a stable baseline against which to notice more nuanced levels of variation. Even so, I’ve noticed on several occasions that the numbers reported on a Monday are relatively low; and I recently heard Casey Briggs refer to ‘hump day’ in one his regular case reports on the ABC (even if I didn’t catch which day he was actually referring to). I’ve also heard vague references by media commentators to backlogs and fluctuations in the processing of test results, which could influence the number of cases announced on any given day.

This is the sort of information that you need to know if, against your own better judgement, you are going to try to extract some kind of meaning from the daily announcement of new case numbers. As I write this, tomorrow is Friday. If the number that pops up on my phone just after breakfast is hardly any lower than today’s, how worried or surprised or disappointed should I be? Is Friday a day when the numbers tend to be higher or lower than would be dictated by the underlying trend?
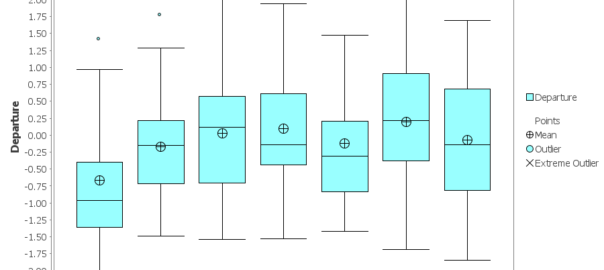
I couldn’t find any existing answers to this question, so I got hold of Victoria’s daily case data and took a stab at answering it myself. I should stress that I did this by following my own statistical intuitions rather than emulating any of the methods used in the papers mentioned above (most of which I hadn’t read until after I did this!). I think my approach makes sense, but I make no claims to it being the best method available. If it turns out that I’ve committed some kind of crime against statistics here, I’ll humbly (indeed gratefully) accept a fine from the statistics police. Continue reading Is there a weekly cycle in Victoria’s Covid case numbers?
