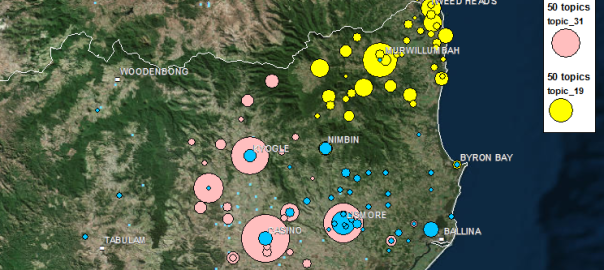
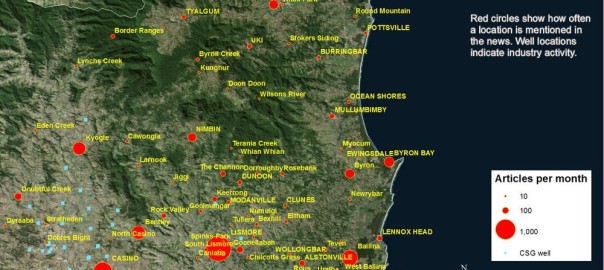
My previous post was all about turning place names in news articles into dots on a map. Using a fairly straightforward method, I matched the place names in a collection of 26,863 news articles against the names and geographic coordinates in the Australian Gazetteer 2012, which lists and locates virtually every named place in Australia. Using such a comprehensive list created a fair amount of extra work, but resulted in a very rich and satisfying visualisation of how the news coverage about coal seam gas has moved over time. Ultimately however, I want to translate these rich visualisations into simpler narratives and numerical descriptions. And to do this, individual statistics for every one of the 1,448 places on my list will not be of much help. I will need some way of aggregating the locations into relevant regions or locales.
To achieve this, one could perhaps use some technique to group the locations based on spatial proximity — something akin to drawing fences around the places that form discrete clusters on the map. But there might be reasons besides proximity to group places together. Spatially distinct places might be united by common issues or events, just as proximate places might be subject to separate laws and controversies. Given that my ultimate object of study is public discourse, such non-geographical unifying factors may prove to be as important as geographical ones.
Latent Deary What?
Only some of these thoughts had crossed my mind when the idea hit me to use a topic modelling technique called Latent Dirichlet Allocation (LDA) to bring some order to my large list of locations. LDA is a technique that automatically identifies topics in large collections of documents, with a ‘topic’ in this context being defined as a set of words that tend to occur together in the documents that you are analysing. LDA uses some clever assumptions and iterative processes to find sets of words that, in most cases at least, correspond remarkably well with meaningful topics in the text. It is widely used for automated document categorisation and indexing, and more recently it has been applied to fields such as history and literary studies under the banner of the digital humanities. If you’re fluent in hieroglyphics, the Wikipedia page might be a good place to start if you want to know more about LDA. If you’re a mere mortal, pages like this one and this one offer a softer introduction.
Like many computational text analysis methods, LDA views each document as an unordered ‘bag of words’. (This might sound like the surest way to render a document meaningless, but the payoff is that it makes the text amenable to all kinds of statistical techniques.) So I figured, why not instead feed the LDA algorithm bags of places, which is exactly what I had created from my collection of news articles when preparing my last post. I saw no reason why LDA couldn’t turn this data into groups of locations that were both spatially and discursively meaningful. Places that are mentioned together in articles are likely to be physically close to one another, linked by social context, or most likely, both. Meaningful groupings of these places could be called geographic topics, or geotopics for short. Continue reading What do you do with a thousand place names?

