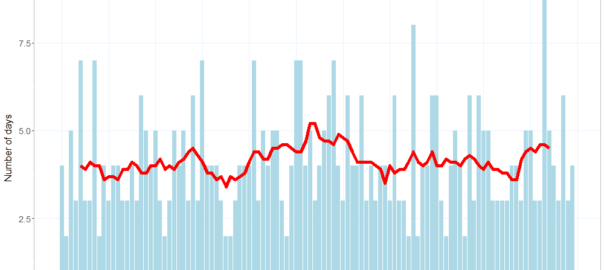
Depending on which weather station you follow, Melbourne is currently on track to experience eight consecutive days with maximum temperatures of at least 30 degrees Celsius. At the Olympic Park station, every day since Thursday 20 January has been over 30°C except for Friday the 21st, which was 29.6°C. At Essendon Airport, where temperatures have been about a degree hotter, Friday saw a maximum of 31.9°C. The temperature in Melbourne as I write this is already over 33°C, and the forecast for tomorrow is 34°C. If Friday’s forecast of 30°C comes to pass, then that would bring the stretch to nine days.
Daily maximum temperatures in Melbourne from 1 December 2021 to 24 January 2022.
I came to Melbourne from Brisbane exactly three years ago, and I don’t recall experiencing a period of continuous heat like this since then. There have been some savagely hot days to be sure, but most of them have concluded with a dramatic cool change, and been followed by a comfortable day in the mid 20s — hence the prevailing yo-yo pattern in the graph above. Every one of these cool changes has made me feel better about my decision to desert Brisbane’s subtropical climate for Melbourne’s erratic weather. A week of 30+ temperatures is what I would expect to endure in Brisbane, and is exactly what I came to Melbourne to avoid.
How historically rare is this current succession of hot days in Melbourne? To find out, I dusted off an analytical tool that I created a couple of years ago to better understand the climatic trends in Brisbane and Melbourne. Called the HeatTraKR, the tool is a workflow for the KNIME Analytics Platform that crunches data from the Bureau of Meteorology to produce a variety of outputs. One of the questions that I created the tool to answer was whether long stretches of hot days were becoming more frequent in Brisbane (the answer was a tentative maybe). So the tool is perfectly equipped to answer my present question about Melbourne’s heatwave. Continue reading A week over 30: How rare is Melbourne’s current heatwave?→
Remember GameStop? You know, the video game retailer whose decaying share price exploded after a bunch of Reddit users bought its stock and succeeded in bankrupting a hedge fund who was trying to short it? Yeah, that was nearly a week ago now, so my memory of it is getting hazy. I mostly remember all the explainers about how the share market works and what a short squeeze is. And the thought pieces about how this kind of coordinated market behaviour is nothing criminal, just ordinary folk playing the big boys at their own game and finally winning. And the memes: who can forget the memes? Well, me, for a start.
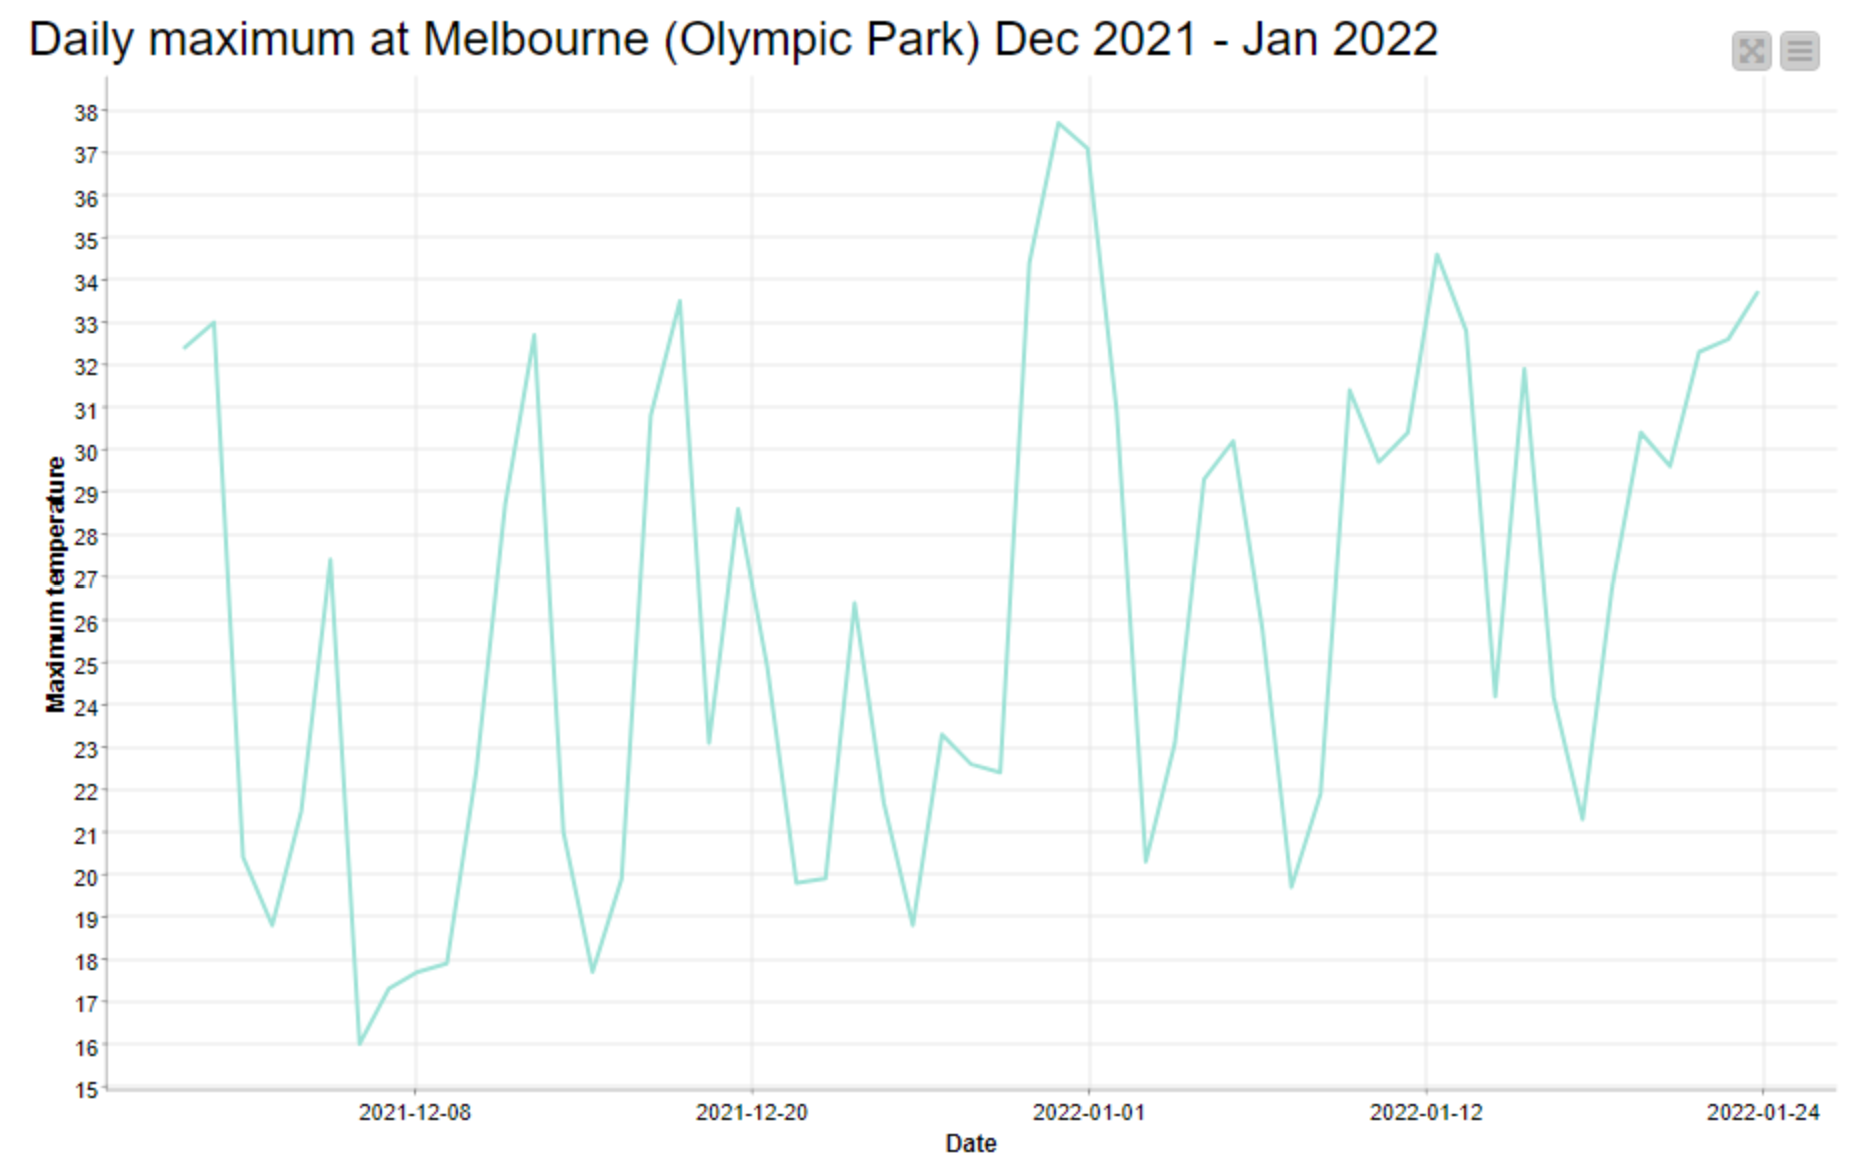
Somewhere amid the madness, I decided that I should harvest some Twitter data about this so-called GameStop saga (can something really only be a saga after only three days?) to capture the moment, and to see whose hot takes and snide remarks were winning the day in this thriving online marketplace of shotposts and brainfarts.
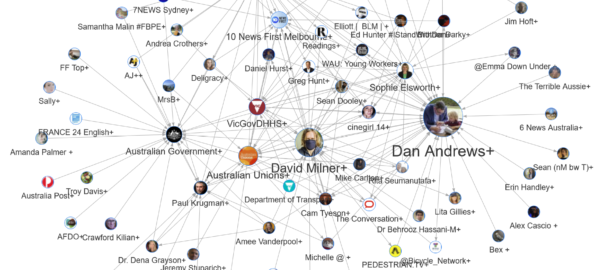
I confess that I had another motive for doing this as well, which was to provide some fodder for my TweetKollidR workflow, which turns Twitter datasets into pretty and informative pictures. The TweetKollidR is a workflow for the KNIME Analtyics Platform that I developed while locked down for three months in the latter half of 2020. I’ve made the workflow publicly available on the KNIME Hub, but it is still in need of road-testing, having been used (by me, at least) to analyse only two issues — the Covid-19 lockdown that spurred its genesis, and the wearisome public discourse about Australia Day. I felt that it was time to test the workflow on an issue that was not so close to home.
So, using the TweetKollidR workflow to connect to Twitter’s Search API, 1 I collected just over 50,000 tweets containing the terms gamestop or game stop. Because I am not paying for premium access to the API, I was only able to grab tweets that were made within about 24 hours of the search (usually you can go back in time up to a week, but the sheer volume of activity around this topic might have shortened the window offered by the API). The 50,000 tweets in the dataset therefore cover just two days, namely 28 and 29 January 2021.
API stands for application programming interface, which is essentially a protocol by which content can be requested and supplied in a machine-readable format, rather than as eye candy. ↩
It’s been part of my routine for several weeks now. Almost like clockwork, at around 8:30am, my phone buzzes. I hold my breath, partly avert my gaze, and unfold the notification just far enough to see the familiar sentence: “Victoria has recorded…”
What comes next can set the tone for the whole day. If the number of new Covid-19 cases recorded in the preceding 24 hours is smaller than the number reported the day before, I breathe a sigh of relief and ease into the day as if a small weight has lifted. If the number has gone up, I slap down my phone in disappointment and try — usually without success — to console myself with the idea that it is probably just a blip that will be corrected with a lower number tomorrow.
I’m sure that the story is similar for many Victorians. It could hardly be otherwise, given that these daily case numbers are now our ticket to freedom, as laid out in the state’s Roadmap to Covid-normality. If the case numbers stay low until September 28 — or more specifically, if the 14-day average at that point is less than 50 — Dan Andrews will let Melbourne residents socialise with up to five people from two households. Luxury! If we get the average down to below five by 26 October, we’ll almost be allowed to behave like human beings again. Under the current framework, our only way out of lockdown is through the numbers.
Given that the only numbers that really matter according to the roadmap are fortnightly averages, it makes little sense to get worked up about the number of cases announced on any given day. Probably we’d all be better off ignoring the daily announcements and getting weekly summaries instead. But I, for one, am not about to kick the habit. As long as that magic number is reported each day, I am going to keep getting my fix and reading into it as much as I can.
Weekly Covid cycles
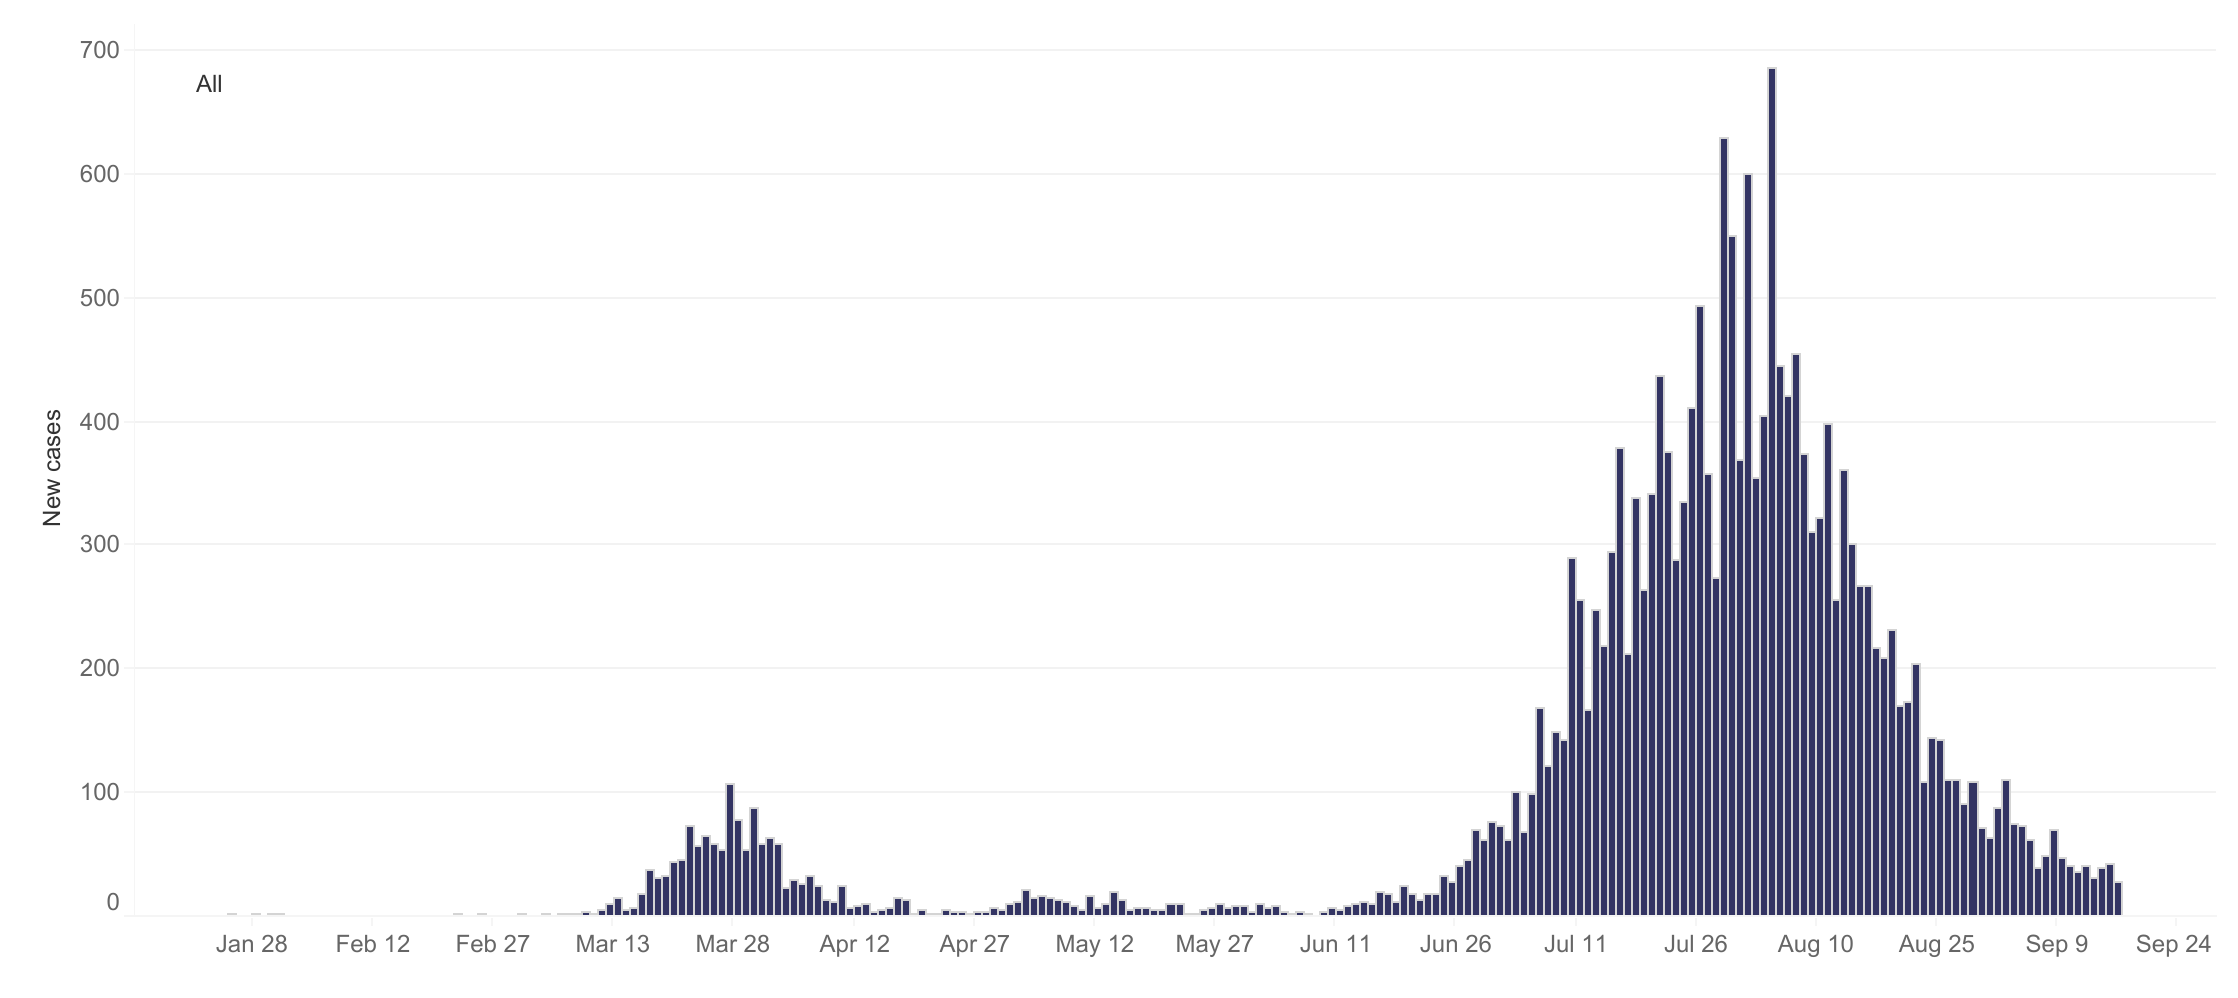
One thing that has become apparent to case number junkies like me is that not every day of the week is equal. On average, certain days of the week tend tend to have higher case numbers than others. You can see this most clearly in the global total, as in the version reproduced below from Our World in Data. Nested within the larger wave of cases is a recurring ripple of a week’s duration.
Surprisingly, there is no consensus yet about why this weekly cycle occurs. The handful of research papers that I have found about the topic all confirm that weekly cycles in cases and deaths are real, but offer contrasting explanations. One paper examining data specific to the US concluded that most of the weekly variations could be explained by quirks in reporting regimes and fluctuations in testing activity. Other studies, especially those looking at countries other than the US, have argued against this explanation and suggested alternative causes. Noting that new cases in several countries tend to peak on Thursdays or Fridays and then fall on weekends, one paper hypothesises that infections rise when the stress of the working week compromises the immune system. Another paper explains the same pattern by suggesting that weekends provide more opportunities for young people to mingle with their elders, thus causing infections that will become symptomatic five days later (i.e. on Thursday or Friday) and leading to deaths about 14 days after symptoms emerge. Yet another paper hypothesises that cycles in air pollution (caused by traffic, for example) or the bodies own circadian rhythms could play a role.
This kind of weekly oscillation has not been as obviously apparent in Australian case numbers, largely because the numbers have been so low to begin with. When cases did get out of control in Victoria a couple of months ago, the Stage 4 lockdown measures introduced in early August turned the numbers around so quickly that there has never been a stable baseline against which to notice more nuanced levels of variation. Even so, I’ve noticed on several occasions that the numbers reported on a Monday are relatively low; and I recently heard Casey Briggs refer to ‘hump day’ in one his regular case reports on the ABC (even if I didn’t catch which day he was actually referring to). I’ve also heard vague references by media commentators to backlogs and fluctuations in the processing of test results, which could influence the number of cases announced on any given day.
Victoria’s daily Covid-19 cases since January (reproduced from dhhs.vic.gov.au )
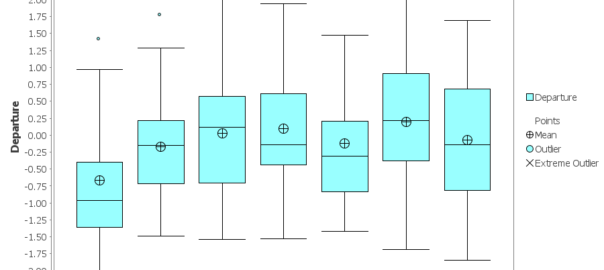
This is the sort of information that you need to know if, against your own better judgement, you are going to try to extract some kind of meaning from the daily announcement of new case numbers. As I write this, tomorrow is Friday. If the number that pops up on my phone just after breakfast is hardly any lower than today’s, how worried or surprised or disappointed should I be? Is Friday a day when the numbers tend to be higher or lower than would be dictated by the underlying trend?
I couldn’t find any existing answers to this question, so I got hold of Victoria’s daily case data and took a stab at answering it myself. I should stress that I did this by following my own statistical intuitions rather than emulating any of the methods used in the papers mentioned above (most of which I hadn’t read until after I did this!). I think my approach makes sense, but I make no claims to it being the best method available. If it turns out that I’ve committed some kind of crime against statistics here, I’ll humbly (indeed gratefully) accept a fine from the statistics police. Continue reading Is there a weekly cycle in Victoria’s Covid case numbers?→
What we talk about when we talk about the lockdown
Back in January, I wrote a lengthy, data-driven meditation on the merits of my relocation from Brisbane to Melbourne. My concern at that time was the changing climate. Australia had been torched and scarred by months of bushfires, and I was feeling pretty good about escaping Brisbane’s worsening heat for Melbourne’s occasionally manic but mostly mild climatic regime.
But by gosh do I wish I was back in Brisbane now, and not just because Melbourne’s winter can be dreary. While Brisbanites are currently soaking up as much of their famed sunshine as they like, whether on the beach or in the courtyard of their favourite pub, Melburnians are confined to their homes, allowed out of the house for just an hour a day. During that hour, we are unable to venture more than 5km from our homes or to come within 1.5 meters of each other, leaving little else to do but walk the deserted streets and despair at all of the shuttered bars, restaurants and stores. All in the name of containing yet another existential threat that we can’t even see.
Of course, just because we can’t see the coronavirus doesn’t mean we can’t talk about it. Indeed, one unfortunate consequence of the ‘Stage 4’ lockdown 1 that’s been in place in Melbourne since the 2nd of August is that there is little else to talk about. We distract ourselves from talking about how bad things are by talking instead about how things got so bad in the first place. On days when our tireless premier (who at the time of writing has delivered a press conference every day for 50 days running) announces a fall in case numbers, we dare to talk about when things might not be so bad any more.
This post is anything but an attempt to escape this orbit of endless Covid-talk. Quite the opposite. In this post, I’m not just going to talk about the lockdown. I’m going to talk about what we talk about when we talk about the lockdown. Continue reading Tweeps in lockdown: how to see what’s happening on Twitter→
Notes:
To date, we’ve been from Stage 3 back to Stage 2, and then up again to Stage 3 before ratcheting up to Stage 4. Hopefully we’ll be back to Stage 3 in a few weeks. We keep using that word, but I don’t think it means what we think it means. If I lapse into calling it ‘Level 4’ instead, that’s why. ↩