Months ago, I assembled a dataset containing around 40,000 Australian news articles discussing coal seam gas. My ultimate aim is to analyse these articles, along with other text data from the web, so as to learn something about the structure and dynamics of the public discourse about coal seam gas in Australia. I’m interested in dissecting how different parties talk about this topic, and how this ‘configuration’ of the public discourse changes over time.
Although I didn’t originally plan to, I’ve focussed much of my energy so far on exploring the geographic dimension of the news articles. I’ve looked at where the news has come from and what places it talks about. This is all important stuff to know when studying such a geographically defined issue as coal seam gas development. But I also need to know what is being talked about, not just where. Now, finally, I am ready to turn my attention to exploring the thematic content of the articles.
Well, almost. I’m ready, but the data isn’t. The dataset that I have been playing with all this time is stuffed with articles that I don’t want, and is missing many that I do. This is because the search parameters that I used to retrieve the articles from Factiva were very broad — I obtained every article that mentioned coal seam gas or CSG anywhere even just once — and because I applied a rather rudimentary method — keyword counts — for filtering out the less relevant articles. The dataset has served its purpose as a testing ground, but if I am to use it to actually say things about the world, I need to know what it contains. And more than that, I need the ability to customise what it contains to suit the specific questions that I decide to explore.
In other words, I need an index to my corpus. I need to know what every article is about, so I can include or exclude it at my discretion. In this post I’ll describe how I have created that index using a method of topic modelling called Latent Dirichlet Allocation, or LDA. Happily, this is the very same method that I was planning to use to analyse the thematic content of my corpus. So by creating an index for my corpus, I am already starting on the process of understanding what it’s all about.
What’s in a search query?
When I set about obtaining my data for this project, all I knew is that I wanted to learn ‘something’ about how coal seam gas has been discussed in the media. So, when Factiva presented me with a blank space in which to enter a search query, I just entered ‘coal seam gas’ and the near-equivalent terms ‘CSG’, ‘coal seam methane’ and ‘coalbed methane’. I didn’t specify how many times these terms had to appear, or whether they had to be the leading paragraph or the body text; nor did I restrict my download to what Factiva deemed the most ‘relevant’ results. I just retrieved them all.
In retrospect, I probably should have used some of these constraints to narrow my search. But on the upside, taking the ‘just-find-me-everything’ approach has forced me to think more critically about the relationship between a search query and the results that it generates. More fundamentally, it has prompted me to think about what I really mean by ‘the public discourse on coal seam gas’. Do I want to examine what people talk about when they talk about coal seam gas? Or am I also interested in what people are talking about when they mention coal seam gas? The former sounds like the more sensible question, but answering the latter could well be of some interest as well, as it could reveal how far the topic of coal seam gas has encroached into discussions about other aspects of life.
In any case, by defining my search as loosely as I did, I’ve ended up with a corpus that covers all possibilities. Some articles mention coal seam gas only once in passing, while others talk about little else — and of course there are many articles occupying the space between these two extremes. Where along this continuum do I want to draw the line? At the moment, I’m not sure. I’m not even sure that there is only one line to draw. The relevance of an article might depend not only on how much space it devotes to coal seam gas, but also on what other topics occupy the remaining space. This is why a detailed thematic index of my corpus — the kind of index that is obtainable through topic modelling — will be so useful for my investigation.
Modelling a lopsided corpus
I briefly describing topic modelling, or at least LDA, which is just one available flavour of topic modelling, in my last post. There are plenty of resources about it available on the web, so I won’t go into any detail here. Essentially, topic models start with assumptions about how documents are generated and structured (these assumptions are formalised into what is called a ‘generative model’), and then employ an inference algorithm to ‘fit’ the words and documents in a corpus to those assumptions. If the assumptions are intelligently chosen (which the use of a Dirichlet distribution helps to ensure), the algorithm will produce weighted sets of words that can interpreted as topics. Every unique term in the corpus is assigned a probability of being associated with (or generated by) each topic. Similarly, every document is assigned a score for each topic, with the score representing the portion of that document that was generated by the topic. This will make more sense soon, I promise!
The magic of topic modelling is that it creates a thematic index of a corpus without drawing on any external information. It’s an act of semantic bootstrapping, conjuring up a classification scheme out of the very text that we want to classify, with no recourse to a thesaurus or dictionary. It works because the text, when understood in statistical terms, is organised by structures that correspond with organising principles in the outside world. In many cases, these organising principles are what we call topics, but as we will see, topic models find structures that arise from other things as well.
The important point is that topic models can only find structures that are already inherent in the data. The resulting classification scheme knows nothing other than what is contained within the corpus. It is likely to be be useless for classifying text that uses a different vocabulary or that covers different subject matter. To a lesser extent, we can expect to see the same failing when we try to classify documents that are thematically or lexically very different from the bulk of the corpus. In effect, the topic model has been ‘trained’ on the bulk of the corpus, and therefore might be biased towards the structures in that part of the corpus, and not be very attentive to the structures within the anomalous part. Increasing the number of topics in the model might resolve this problem — or then again it might not, and/or it might introduce a bunch of additional topics that we don’t need.
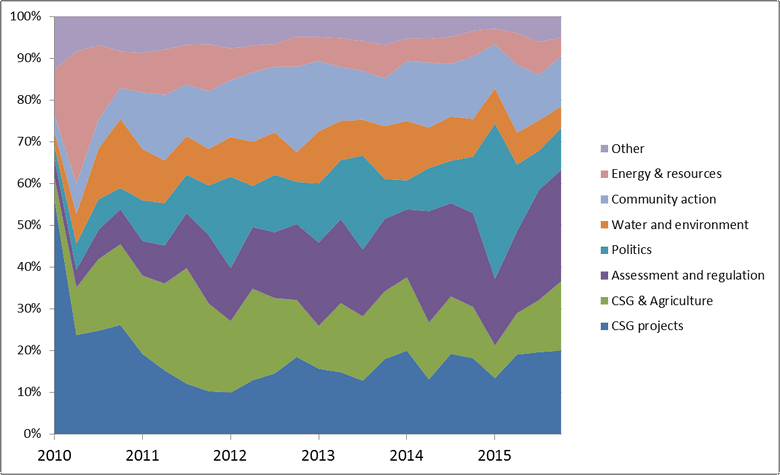
In any case (and to finally come to the point!), the reason why this issue was playing on my mind is captured in the following graph. The white line shows how the documents in my corpus are distributed over time, while the river of jagged, coloured bands shows the output of a preliminary topic model that I ran on my crudely filtered corpus just to get a sense of the results. Each coloured band represents one of 40 topics, and is sized vertically to show the share of that topic across the corpus.
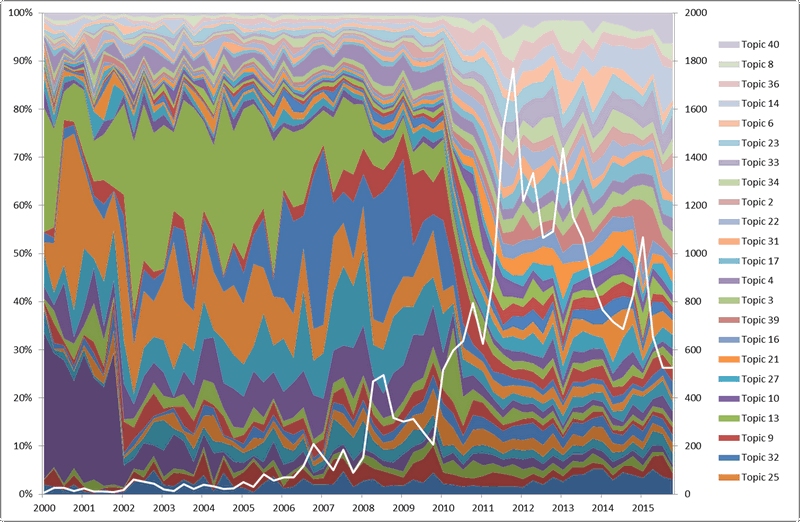
Without even knowing the content of the topics, we can see that their representation across the corpus shifted dramatically in 2010. Before this point, just a few topics dominated. By the beginning of 2011, these topics are almost lost amid a crowd of other topics that were barely present in the earlier period. Meanwhile, the overall number of articles in the corpus grows dramatically, such that the bulk of the corpus lies in the years after 2009.
The simultaneous shifts in the size and composition of the corpus are sufficient to make me wonder if one topic model can adequately capture the whole lot. More specifically, I wonder if the pre-2010 data can be described accurately by a model that is trained mostly on data in which the subject matter is very different. A more intimate understanding of how LDA works might convince me that I could overcome this problem by increasing the number of topics in the model. And I know that for most reasonable research questions that might pose, a time-imbalanced topic model would be perfectly adequate anyway. But for this particular task, which is intended to result in the permanent expulsion of some articles from the corpus, I want to be sure that I am representing the earlier part of the corpus faithfully. So I decided to split the corpus into two parts, one covering the period up to 2010, and the other covering the period from January 2010 onward.
Preparing for lift-off
Topic modelling is computationally expensive, and can take a serious amount of time if steps aren’t taken to minimise the amount of data to be analysed. This means removing words that have little value for the classification task being performed. My text pre-processing included the usual steps of removing stop-words, numbers and punctuation. In addition, I removed all proper nouns except for the names of organisations. I did this because I felt that the names of people and places would not add much value to the topic model, while the names of organisations, especially gas companies, would be useful markers of how relevant a topic is to discussions about coal seam gas. I also removed words that occured in fewer than five documents.
Another common word-reducing step is to remove words that have a low TFxIDF (term-frequency x inverse document frequency) score. Like stopwords, these are words that occur so frequently throughout the corpus, and/or so rarely within individual documents, that they offer little discriminatory power. I’ve seen examples where as many as half the words in the corpus are removed this way, but I chose to be more conservative. In the 1996-2009 corpus, which was fairly small to begin with, I removed just two per cent of the terms based on the TFIDF score. I did this because I wanted my topics to be as descriptive as possible, and by raising the threshold much higher, I found I was losing words that helped me to interpret the topics. A perfect example is the term ‘coal seam gas’, which although present by design in nearly every document, I nonetheless wanted to see within my topics. The reason why will become clear soon.
In the much larger 2010-2015 corpus, I removed ten per cent of terms, partly to accommodate the larger size of the corpus, but also because by this stage I had cottoned onto the strategy of selectively not removing certain terms that I was interested in.
I used Knime to do all of the above text pre-processing. I could have done this in R instead, but I already have a text processing workflow established in Knime, and at any rate I prefer working in Knime’s more intuitive, visually oriented environment whenever I can.
I used both R and Knime to do the actual LDA topic modelling. I modelled the 1996-2009 corpus in R, using the ‘topicmodels’ package. I used Knime, however, to generate the document-term matrix that served as the input. For the 2010-2015 corpus, I used the parallel LDA node in Knime to do the topic modelling. I was more or less forced to do this because the document-term matrix was too large for R to handle, at least without the assistance of additional packages or memory resources which I was not in the mood to provide. But even without that obstacle, I may well have ended up using Knime, simply because its algorithm runs so much faster than R — no doubt because it makes better use of parallel processing.
I reassured myself that Knime and R produce similar results by also modelling the 1996-2000 corpus in Knime. Thankfully, the topics that each platform generated were very similar indeed.
Having shed the excess baggage, we are now ready for liftoff. Onto the results!
The 1996-2009 corpus
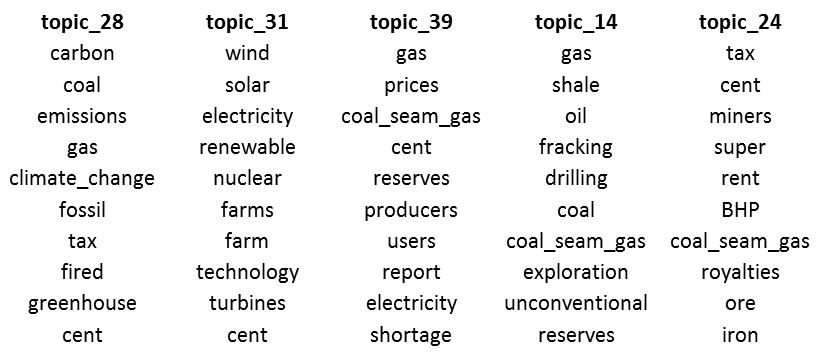
The 1996-2009 corpus contains 6,622 articles. I chose to model it with 30 topics, which in retrospect is probably more than I needed. In a topic model, a topic is defined as a unique mixture of the words in the corpus. More accurately, a topic is a probability distribution across all terms, such that each term is assigned a probability of having been generated by any given topic. What all this translates to is a weighted or ranked list of terms that defines each topic. Here are the top ten terms from five of the 30 topics generated for the 1996-2009 corpus:
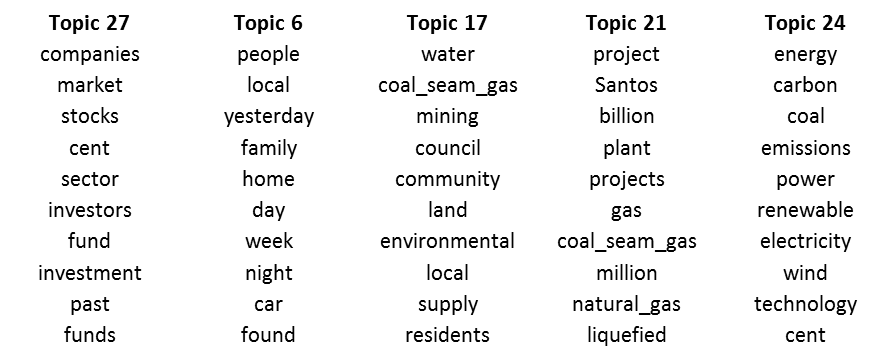
The quickest way to interpret LDA topics is to look at the terms and come up with a theme or narrative that unites them. Topic 27, for example, clearly has something to do with finance and investment, while Topic 24 relates to electricity generation. Usually such a theme or narrative is readily apparent, but sometimes it isn’t. In either case, it pays to check the meaning of a topic by also inspecting the documents in which it is prominent. LDA makes this very easy to do, as it assigns to every document a score for every topic. This score represents the portion of the document that has been ‘generated’ by a given topic.
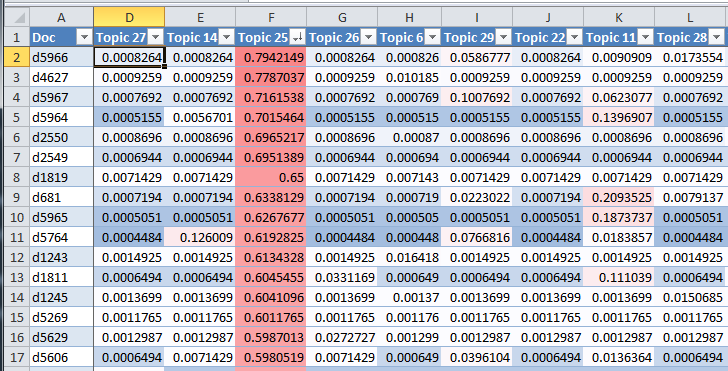
The example below shows the scores for a selection of topics and documents. I’ve loaded the data into Excel and coloured the scores as a heatmap. In this instance, the data is sorted by the scores for Topic 25. The left-hand column shows the the unique ID number for each document. We can see, for example, that the algorithm has assigned 79% of the words in document d5966 to Topic 25, and very few of the words in that document to the other topics visible here. We can also see that the scores for Topic 25 correlate very poorly with the other topics shown, except perhaps for Topic 11, which shows higher values relative to the others. It turns out that Topic 25 is about corporate activities and decision-making, while Topic 11 is about government policy decisions, so it seems reasonable to expect some degree of correlation between the two.
The five topics listed earlier in Figure 2 capture fairly well the scope of the 30 topics that the LDA algorithm found:
Topic 27 is clearly related to financial matters, as are 10 other topics in the model. Yet in all but three of the 11 financial topics, the term ‘coal seam gas’ is missing from the 100 most strongly weighted terms, suggesting that those topics describe documents that deal primarily with financial matters unrelated to coal seam gas. Upon inspection, this turns out to be the case. The corpus is littered with wide-reaching stock and investment reports, many of which mention coal seam gas (or more typically, a coal seam gas company) only once.
Finding two tiers of financial topics is doubly useful to me: not only can I remove all financial news if I want to, but I can also choose to keep just the financial news that is likely to be about coal seam gas. This, by the way, is why I chose to keep the term ‘coal seam gas’ in the data that I fed to the LDA algorithm: its presence in a topic serves as a proxy to that topic’s relevance to coal seam gas.
Of the five topics shown, Topic 6 looks most like it doesn’t belong. It certainly isn’t about coal seam gas; in fact, it doesn’t look to be about much at all. Sure enough, the documents allocated to this topic are completely irrelevant to my investigation. Mostly, they are articles that use the term ‘CSG’ to mean something other than coal seam gas, such as the name of a computer technology company or the letters on a car licence plate. Two other topics are defined along similar lines, with one of them indexing little else except articles about Telstra’s Customer Service Guarantee. These three topics should prove very useful for removing irrelevant articles from my corpus.
Topic 27, in contrast, is unmistakably about coal seam gas. However, like all of the other CSG-related topics, it is not about coal seam gas per se, but rather about coal seam gas in some particular context. In this case, that context relates to water, land, and communities. Beyond the top ten terms are words like ‘salt’, ‘waste’, ‘farmers’, and ‘drought’. The articles that are most strongly allocated to this topic all discuss using the ‘waste’ water produced by CSG extraction to supply drought-stricken towns and farmers. A handful of other CSG-related topics cover aspects such as gas exploration, extraction, and use for electricity.
There are several topics in the model like Topic 21, which relate to the projects and activities of specific gas companies. Each one tends to emphasise a different company or project.
Finally, there are several topics like Topic 24, which while not being explicitly about coal seam gas, are nonetheless about some closely related topic — in this case electricity production and carbon emissions. Other examples include topics about jobs and regional development, and government policy and regulation.
So, altogether I have some relevant topics, some irrelevant topics, and some that are relevant even though they are not specifically about coal seam gas. Before moving on to the pruning stage, let’s look at the breakdown of these topic classes over time:
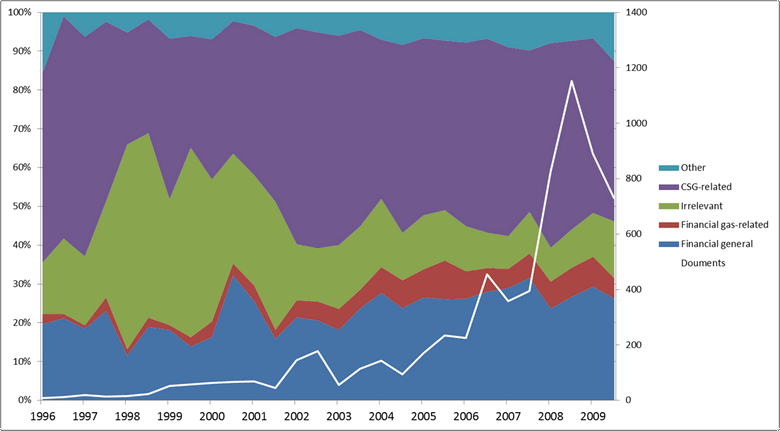
The good news is that CSG-related topics account for nearly half of the corpus (47% of it, to be precise 1). The bad news is that irrelevant and financial topics account for just as much. The overall share of financial topics, whether gas-related or not, appears to gradually increase, suggesting that CSG featured more and more frequently in financial news.
The most striking feature of the graph, however, is the burst in irrelevant topics between about 1997 and 2000. Plotting the irrelevant topics on their own reveals the culprit:
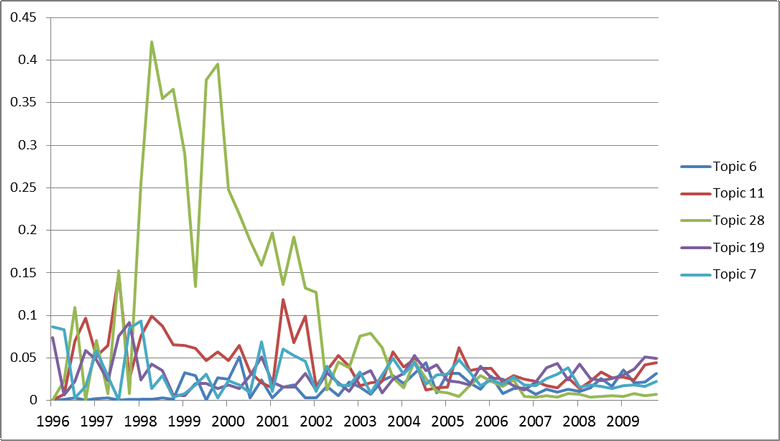
Dwarfing the other irrelevant topics topics in the years between 1997 and 2000 is Topic 28, which almost exclusively indexes articles about Telstra’s Customer Service Guarantee (not the kind of CSG I am interested in). In the second quarter of 1998, this topic accounted for more than 40% of the — wait for it — nine documents in the corpus.
A pruning strategy
Having such a richly defined index of my corpus means that I don’t necessarily have to prune or filter out anything. Rather, I could select what topics I am interested in for each analysis I undertake. But with so many documents clearly of no interest to me, I though it would be worthwhile to create a cleaner version of my corpus.
To do this, I sorted the documents in Excel in descending order according to their combined score for relevant and ‘neutral’ topics, and worked my way down the list, checking documents randomly until I was satisfied that almost none of them were of interest to me. This point occurred when the combined score was about 0.25, meaning that the LDA algorithm determined that a quarter of each document had been generated by relevant or neutral topics. This cutoff was somewhat arbitrary, but also deliberately conservative, in that I would rather retain some irrelevant articles than exclude relevant ones. Finally, I marked for exclusion all of the 1,750 documents (amounting to 26% of the total) scoring less than 0.25 on this combined measure.
The share of topics in the resulting filtered corpus looks like this:
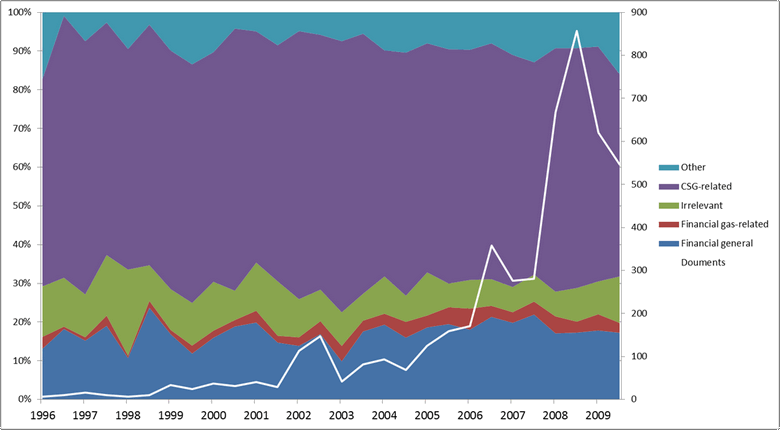
Comparing this with the corresponding graph in Figure 4, we can see that the overall share of CSG-related topics has increased, and the share of financial topics has decreased. There is still some financial and irrelevant content in the corpus, but less than before, and the portion of irrelevant content is more consistent over time, meaning that the articles about Telstra have been removed.
I will undoubtedly filter the corpus further in each analysis that I do, but now I have a much less noisy dataset to work with than I had before. So, what about the rest of the corpus?
The 2010-2015 corpus
The 2010-2015 corpus contains 34,047 articles — about five times as many as the 1996-2009 corpus. To accommodate the larger size and wider range of issues discussed, I chose to model 50 topics, which in retrospect was only just enough. As expected, the overall assortment of topics that emerged was very different from what emerged from the 1996-2009 corpus.
CSG-related topics
Nearly half of the 50 topics modelled for the 2010-2015 corpus are unambiguously about coal seam gas in some way. One group of topics (Figure 7) relates to the gas projects being developed by companies such as Santos, Origin, Arrow, Shell, QGC and BG. Topic 18 is the odd one out in this lineup, as it is features companies like Woodside and Chevron, which (as far as I know) aren’t involved in Australia’s CSG-LNG industry, but rather the conventional LNG industry. (And in case you’re wondering, the topic names look different in this section because I used Knime instead of R to do the modelling.)

At least ten topics relate to environmental implications of coal seam gas. The first five, listed in Figure 8, include references to regulatory processes and responses. Five further topics (Figure 9) emphasise the investigation and assessment of environmental impacts. Interestingly, one of these topics appears to revolve around an episode of the ABC’s Four Corners. The terms beyond the top ten suggest that this topic might be picking up investigative reporting into matters besides coal seam gas.


Then there are topics relating to the intersection of coal seam gas development and the community. As shown in Figure 10, these topics refer not just to protests, meetings and campaigns, but also to film, music and art. Topic 34 indexes articles about music and films that discuss coal seam gas, while Topic 41 links to articles about community events such as festivals, shows and exhibitions. Coal seam gas features in these events in a variety of ways, from being a source of corporate sponsorship to being the focus of protests. Topic 41 also indexes further instances of coal seam gas being a subject of the arts. One such article is about a portrait painted of one of the Knitting Nannas against Gas, while another is about a poetry competition in which one entry is about coal seam gas.

Still on the theme of the community, there are four topics focussed on agricultural and rural communities. Shown in Figure 11, these cover access rights and compensation (Topic 11), information workshops for landholders (Topic 3), impacts on housing due to a booming workforce (Topic 36) and farming in general (Topic 4).
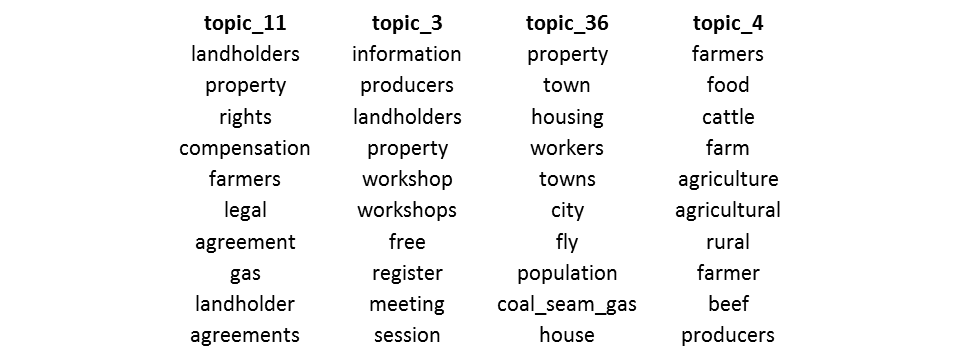
Figure 12 shows a set of topics that place coal seam gas in the context of other resource and energy matters, such as carbon emissions, renewables, oil and gas reserves, and the minerals resource rent tax.
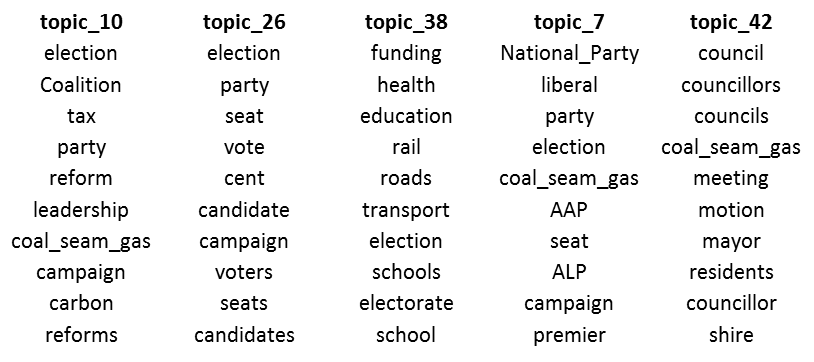
Given the level of controversy surrounding coal seam gas development, we might expect that it has become a highly politicised issue. And indeed, the LDA algorithm found five separate topics relating to politics. Four of these relate to state and federal politics, while the fifth (Topic 42) concerns local government matters. With the exception of Topic 42, all include ‘election’ among the top ten terms.
The relevant and irrelevant others
So, I have a rich assortment of CSG-related topics in my corpus. Yay! But that much I was already hoping for. What about the things I wasn’t hoping for? Usefully, the LDA algorithm made topics for them them as well. Six such topics are shown in Figure 14. Topics 16, 20 and 40 cover news roundups or general news stories that happen to mention coal seam gas in passing. Topic 2 indexes what you could call ‘community noticeboard’ announcements about meetings and events. Topic 6 and 9 do something quite different, and to me are the most interesting and exciting.
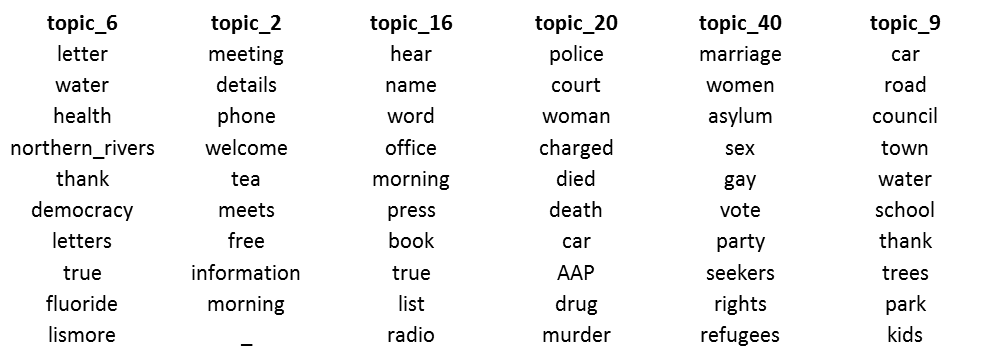
With remarkable accuracy, Topic 6 catalogues documents consisting of reader-submitted letters, texts or tweets. Many of these documents present several different letters together, and so distinguish themselves by the wide array of topics that they discuss. But news roundups are much the same in this regard, and they are collected under separate topics (especially Topic 20). What Topic 6 seems to have done is identify a large set of words that, whether on their own or in combination, are far more likely to appear in letters than in conventional news content. Some examples (including terms from outside the top ten) are ‘democracy’, ‘fluoride’, ‘rights’, ‘science’, ‘wish’, ‘destruction’, and ‘corporations’.
Topic 9 also indexes reader-submitted content, but with more emphasis on tweets, facebook posts and SMS texts, and on local issues.
I find these two topics exciting because independently of this exercise, I had already started trying to identify and separate the reader-submitted content by using other markers, such as first-person pronouns, question marks and exclamation marks. Almost all of these markers were removed from the text prior to running the LDA algorithm. Without any prompting from me, the algorithm has successfully classified much of the reader-submitted content by using an entirely different set of markers. By combining the scores for this topic with those for my own markers (which I hope to do by using a technique called a vector support machine), I stand a good chance of cleanly separating the this content from the rest of the corpus. This not only reduces the level of ‘contamination’ among the news articles, but also delivers me a new dataset that could be well worth analysing on its own, or in comparison with the news content.
There are just a handful of topics I haven’t shown here. These include some that are not explicitly about coal seam gas but are nonetheless potentially relevant (one is about wildlife habitat, for instance), as well as three topics about markets and finance. The prominence of financial topics is a point of distinction between the 1996-2009 and 2010-2015 corpuses. Such topics accounted for 11 of the 30 topics in the earlier corpus, and just three of the 50 topics in the later one.
2010-2015 corpus breakdown
Figure 15 shows a high-level breakdown of the topics in the 2010-15 corpus. Happily, the CSG-related and ‘relevant other’ topics account for the bulk of the content. Meanwhile, financial news occupies a much smaller portion here than in the 1996-2009 corpus, although its share is still quite high in the first few months. Irrelevant content is also low compared with the earlier corpus. Letters and other reader-submitted content account for about 5% of the corpus, yet were relatively insignificant at the start of the time period.
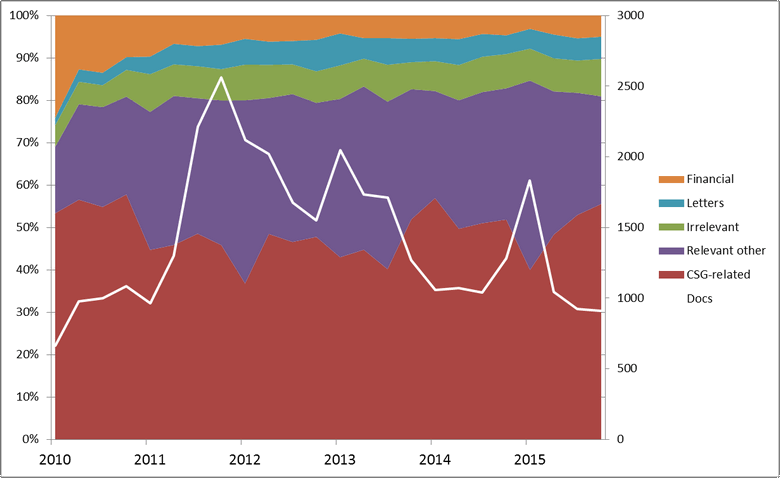
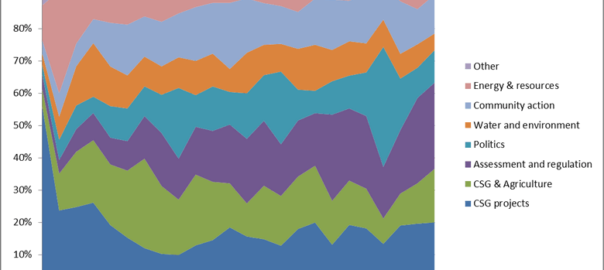
Figure 16 shows a more detailed breakdown of just the relevant topics, divided into similar classes as were used in the earlier discussion. The first thing that jumps out at me is how evenly distributed these classes are, and how little the overall mix changes after the first year. The second point of interest is how different the first six or nine months look from the remainder. Two things happen in this early period. The first is that the coverage of CSG projects gives way, in relative terms, to a host of other topics that initially are barely represented. All of the discussion about community action, water and environment, politics, regulation, and so on, emerges from virtually nothing in the first six months. The second thing that happens in this period is that the energy & resources class exhibits a big spike before returning to its baseline level. Digging deeper into the individual topics reveals that this spike relates to coverage of the Minerals Resource Rent Tax (Topic 24 in Figure 12), which was being widely debated at that time.
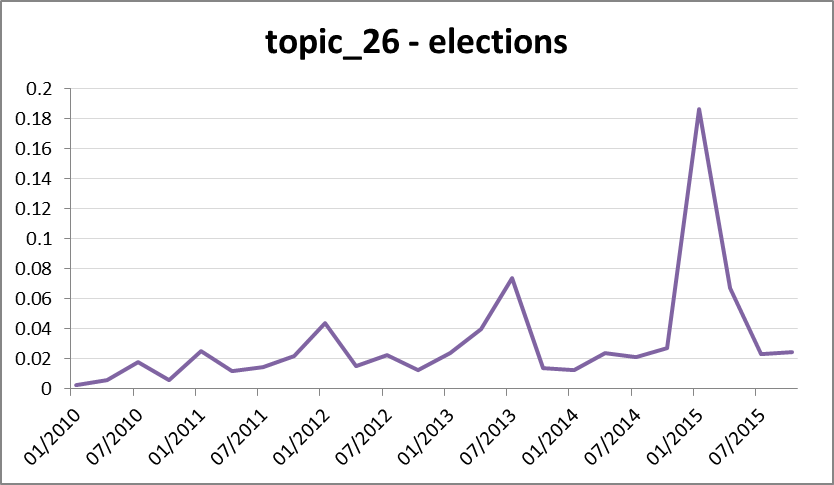
Also notable in Figure 16 are the periodic spikes (or bulges?) in the politics class. The reason for this isn’t hard to guess, given the prominence of the term ‘election’ in these topics (see Figure 13). We can see the political pulse of the nation most clearly in Topic 26, which suggests that coal seam gas has become more of an election issue over time.
Beyond these obeservations, there’s not much to see, at least at the level of aggregation used in Figure 16. Inspecting trends and relationships among individual topics will no doubt prove more insightful, but I’ll leave that for future analyses (and indeed, future topic models, since I won’t be using this one for anything other than indexing purposes). I’ll finish this section with just one more graph of these aggregated classes. Figure 18 compares the relative prominence of topics relating to the assessment and regulation of coal seam gas, with topics relating to action and involvement from the community, including protests and meetings. The two classes initially increase in close synchrony but diverge in 2013, at which point community action drops to a new steady state while assessment and regulation continues to increase, albeit with some sizable dips.
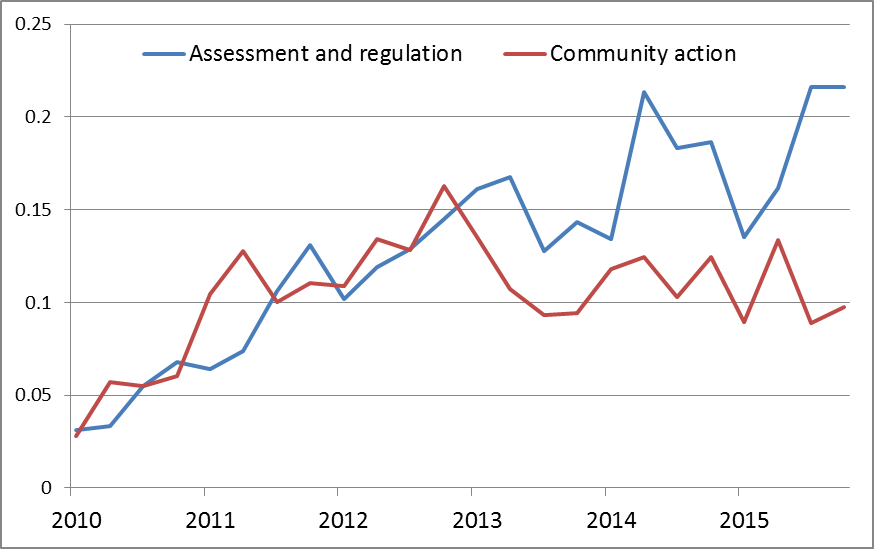
Does this mean that the community backed off while (or because) government and researchers continued to increase their efforts? Or does it reflect a shift in what reporters deemed newsworthy? Without digging further, I can’t tell you. But this is a dynamic that I may well explore later on.
The final cut
I’ve quite seamlessly digressed into analysing the content of my corpus rather than sticking to my stated aim of merely indexing and filtering it. In part this is because I have decided that there is not much pruning to be done to the 2010-2015 corpus. Unlike with the earlier corpus, the financial news is not cleanly separated into news that is about coal seam gas as distinct from other resources (modelling a higher number of topics might change this). And most of the topics that aren’t explicitly about coal seam gas are too potentially useful to remove at this stage. As for the readers’ letters, I intend to separate them in a future exercise using another method. In the end, there are only two classes of documents in the 2010-2015 corpus that I’m happy to dispense with permanently:
- general news roundups, which I identified as any document scoring above 0.32 for Topic 20; and
- community notices (for meetings, classes, etc.), which I identified as documents scoring above 0.2 for Topic 2, unless they also scored above 0.2 for Topic 35, which indexes articles discussing meetings about coal seam gas.
This amounts to 966 documents, or just under 3% of the 2010-2015 corpus.
So in total, I removed 2,710 articles out of the 40,669 in my original corpus. This amounts to a mere 6.7 per cent, and this is largely because I chose not to remove much from the 2010-15 part of the corpus. Instead, I will exclude the irrelevant articles in that part of the corpus by selecting only the articles relevant the questions I investigate. That I am now in a position to do this is quite remarkable, and a testament to the effectiveness of LDA topic modelling. I look forward to harnessing that power for more novel and exciting purposes as I proceed with my investigations.
Notes:
- This is the percentage of all terms in the corpus that were allocated to CSG-related topics. Measured as the percentage of documents that were more about these topics than anything else, proportion is 51%. ↩
Very interesting Angus