As explained in the About page, I have recently commenced a PhD. Barely eight weeks in, I am still enjoying what I’ve heard described as the honeymoon phase, where all I need to do — indeed all I really can do — is immerse myself in new ideas, literature, software, and on-campus drinking outlets. You could also call it the pig-in-mud phase, since that is essentially what such activities equate to for someone like me. Milestones and progress indicators will come later (though soon enough I am sure!); right now my concern is to arm myself with knowledge and tools for the long road ahead, wherever that road may end up leading.
In broad terms, the task I have set myself is to use digital methods to explore and make sense of some social phenomenon, such as the discourse around a contentious issue. The case study that I have chosen to get me started is the recent expansion of the coal seam gas (CSG) industry in Australia. Coal seam gas (known as coal bed methane in the United States) has been used in Queensland to generate electricity for more than 20 years, but the industry has boomed since about 2008 as local gas companies race to get their gas into the global export market. This ‘gas rush’ has brought the industry into previously uncharted territories — first the prime agricultural areas of the Darling Downs in southern Queensland, and now several agricultural and pastoral regions of New South Wales.
To cut a long story short, a lot of people have become very concerned about coal seam gas. And while many of these concerns have been expressed through traditional, on-the-ground methods like marches and blockades, much of the debate around coal seam gas has unfolded, or at least been documented, on the web. A wide range of voices can be found, including those of individual citizens, grassroots action groups, seasoned lobbyists, government agencies, industry groups, research institutions, and of course, the news media. All of which makes the issue a perfect case study for my present purposes.
I should make clear, however, that I do have a personal interest in the topic. As a State Government employee, I worked for several years on a project about coal seam gas water management. I have also worked for about a year in a research centre at the University of Queensland that is concerned with both the impacts and the opportunities presented by coal seam gas. So I’ve become acquainted with a few small corners of the industry and how it is managed, and I have watched the debate around the industry unfold over a number of years. And while I have my own thoughts about the merits or otherwise of industry, I am not going to discuss them here. I am not concerned with who is right or wrong, but with how the debate around coal seam gas has developed. Who are the participants? How do they and their discourses interact? Which ideas and beliefs have shaped the debate, and how?
Learning to crawl
In this post I want to examine which organisations are involved in the debate about coal seam gas. One way to do this would be to read lots of news articles and web sites and simply make list a of every organisation that pops up. I may yet have to do just this, but as a first step I wondered if there was a way to get a computer to do the hard work for me. Many of the organisations active in the CSG debate have a presence on the web, and they tend not to work in isolation. Typically, the website of each organisation will provide links to the websites of other organisations with similar aims or values. Often a website will also link to ‘external’ authorities or information sources such as news media or government websites. By identifying the links from one site to another, it should be possible to build up a picture of the network of organisations and information sources active in the issue.
This is a conceptually simple procedure: visit a web page, extract the hyperlinks, record them, follow them, and repeat (but don’t repeat forever). It is a simple exercise in web crawling, the process whereby a computer program — commonly known as a crawler, robot, or spider — crawls from one link to the next, building up an index of what it finds. This is how Google and other search engines bring order to the mindboggling vastness of the web.
Writing a program or script to perform this procedure might be relatively simple as well, except that I don’t know how to code. Thankfully, someone else has done this already. There are several web-crawling programs and services available, but the one that seems to suit my needs best is Issue Crawler, a tool developed by the Govcom.org Foundation in Amsterdam to locate and visualise networks on the web. The only input that Issue Crawler requires (apart from some basic parameters of the crawl to be performed) is the addresses of a few known web pages (ideally the ‘links’ pages that explicitly link to other sites) in the network that you want to study. Thus primed, the crawler goes forth and collects the data needed to assemble the network.
Once the crawl is complete (which in my case took a couple of days), you can inspect the network using Issue Crawler’s native visualisation, or you can download the data to explore it using other software. I chose to do that latter, partly because my network was apparently too big for the native visualiser to handle, but also because I was keen to explore the data in one of my favourite programs — Gephi. Gephi is a free, open-source program for visualising and analysing networks. It’s not the most intuitive program you will use (whoever called it ‘Photoshop for graphs’ certainly got that much right), but with a moderate amount of poking around, you can get very useful results.
The network that I will explore here is the result of a ‘snowball’ crawl, which is one of three types of crawl the Issue Crawler can perform. The snowball crawl follows the procedure I described earleir: it visits the specified starting pages, 1 records the outgoing links, and then does the same thing starting from each of the linked pages. My crawl stopped there. You could do another iteration, but only at the risk of collecting a vast number of links with very little relevance. A more constrained type of crawl, called a co-link analysis, uses a similar process but only retains links that have at least two sources in common. For comparison, I will also briefly present the results of a co-link analysis performed with the same starting pages.
Order from chaos
Issue Crawler provides its network data in Gephi’s native graph format (.gefx), so you can load your crawled network into Gephi with just a few clicks. Just don’t expect instant gratification. When I first loaded the data into Gephi, I got something like this: 480 nodes, 1379 connections (edges), and no structure whatsoever.
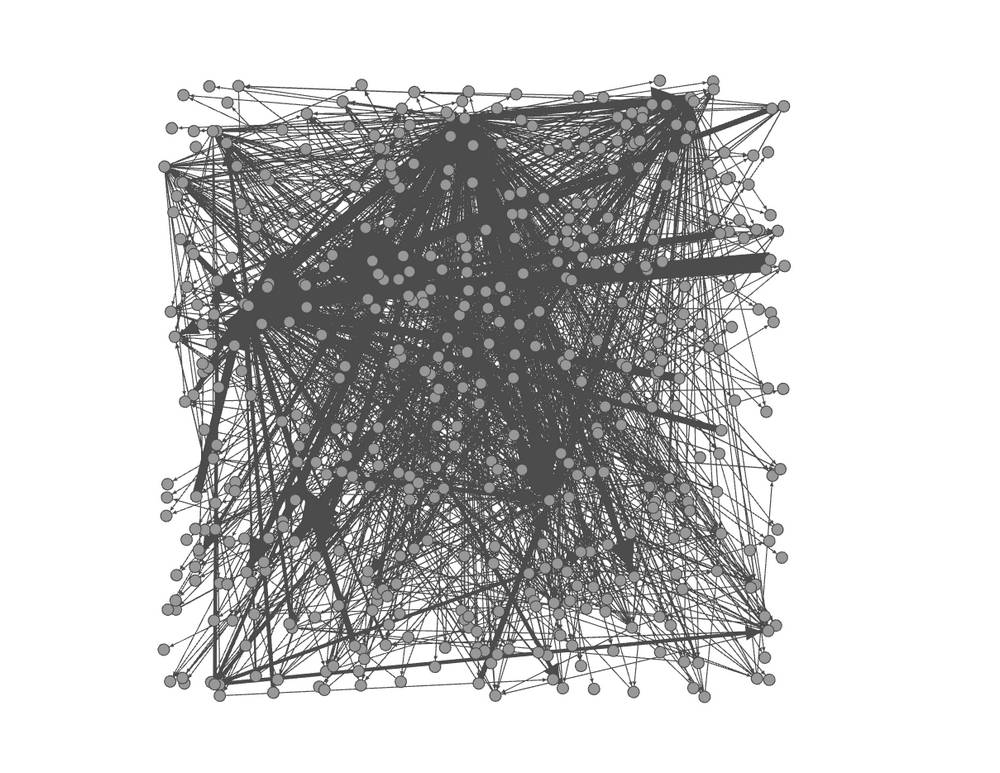
To bring some structure into the network, we need to apply a mapping algorithm. My usual go-to algorithm, Force Atlas, didn’t offer much joy, bundling everything up into one tight cluster which kept moving about the screen. The Yifan Hu algorithm does a little better, revealing several distinct hubs around which the remaining nodes cluster.
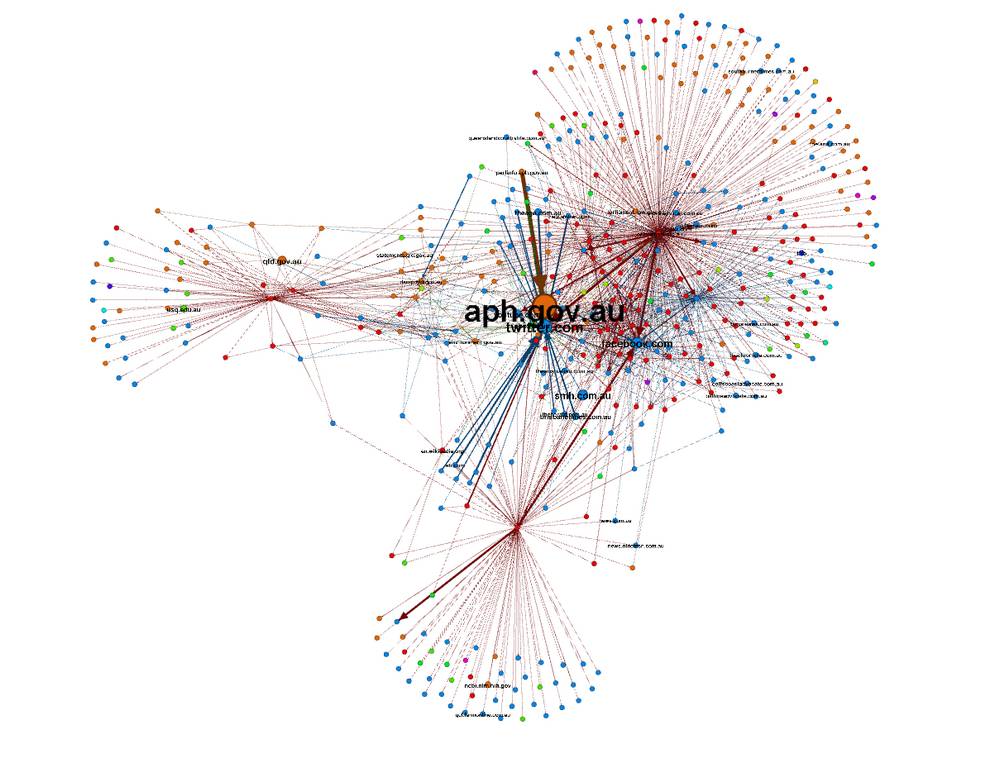
Each node in this network is a whole website, rather than a separate page. The nodes in this figure are sized according to number of incoming links to the pages within the site (Issue Crawler terms this the ‘authority’ of the site.) The colours reflect the top-level-domain (.com, .org, etc.) of the website. The strength and direction of the connectors reflects the number of links between pages within the connected sites.
The largest node by far in this grahp is aph.gov.au, which is the website of the Australian Parliament. This is not what I expected to see in a network of CSG-related sites, so it demanded some further investigation, which I will detail shortly. The next largest nodes are Twitter, Facebook and the Sydney Morning Herald.
A spot of pruning
For a more orderly view of the network, I tried the Circular Layout algorithm, which rendered the following ‘ball of string’:
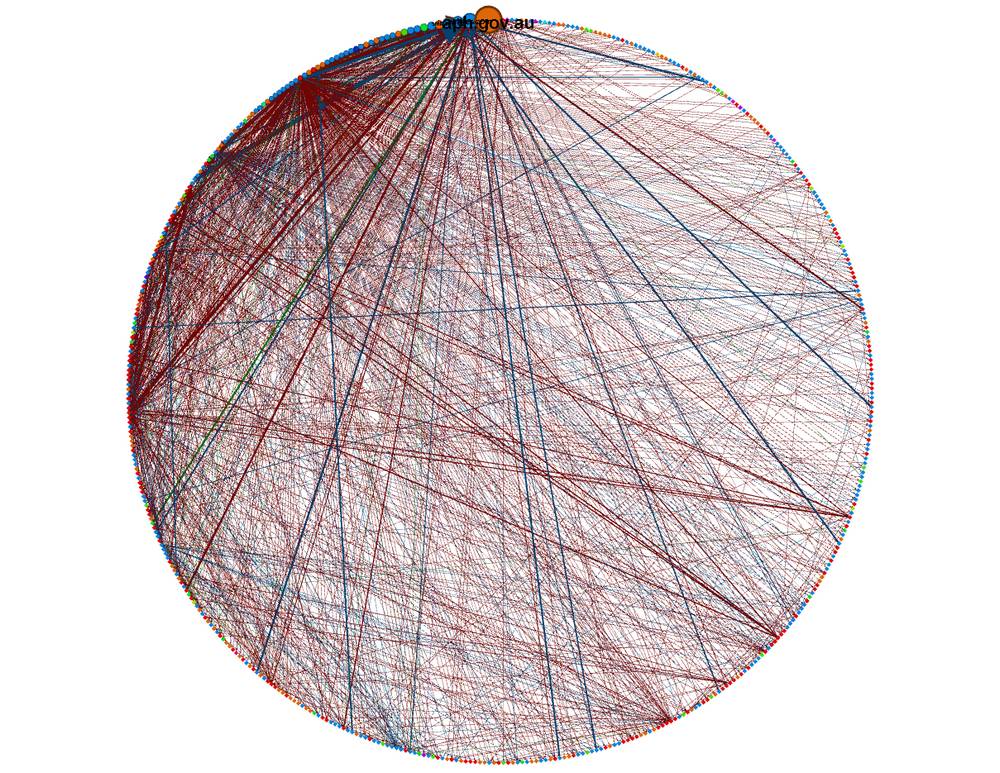
The above picture shows clearly that the majority of the 480 nodes are equally small, meaning that few other sites in the network link to them. This picture also shows which pairs of nodes have particularly strong connections, indicating a lot of links from (at least) one to the other. Twitter, for example, which is the second-largest node, has strong links coming in from all directions. The reason for this is that many sites (especially news media sites) feature a link to their twitter feed on every single page. This repeated linking means that these strong connections are not in fact very informative, and could even be overshadowing the more ‘organic’ strong linkages in the network. One way to correct for the influence of these connections would be to manually reduce their values, but I opted for the more drastic solution of removing Twitter from the network altogether. While it is useful to know which organisations are using Twitter, I am more interested in studying the links among the more issue-focused organisations, so presence of Twitter on the graph is something of a distraction. The same goes for Facebook, which is the next largest node on the graph.
Another suspiciously strong link, visible in both of the preceding graphs, is that between aph.gov.au and parlinfo.aph.gov.au. Given that the latter is just a subdomain of the former, I am not sure why Issue Crawler treated it as separate. In any case, parlinfo.aph.gov.au is a search page for finding all kinds of parliamentary documents, such as bills, transcripts and committee reports. The Issue Crawler picked up literally hundreds of search queries, all of which linked back to aph.gov.au, hence the many connections recorded between the two sites. Since parlinfo.aph.gov.au had very few links from other sites, I simply removed it from the network.
After removing these and a few other unhelpful sites from the network, I hoped that the Force Atlas algorithm would be able to handle it, but it just gave me another tight bundle of jittering nodes. It turns out that to make this work, I first had to ‘flatten’ the network. While the graphs that you see here depict links from one site to another, Issue Crawler actually compiles the data for every individual page. A node for every page is created in the data that Issue Crawler exports to Gephi, but these are all grouped into the ‘virtual nodes’ (sites) that you see in the network. The ‘Flatten’ filter in Gephi transforms these virtual nodes into real ones, and discards the individual pages.
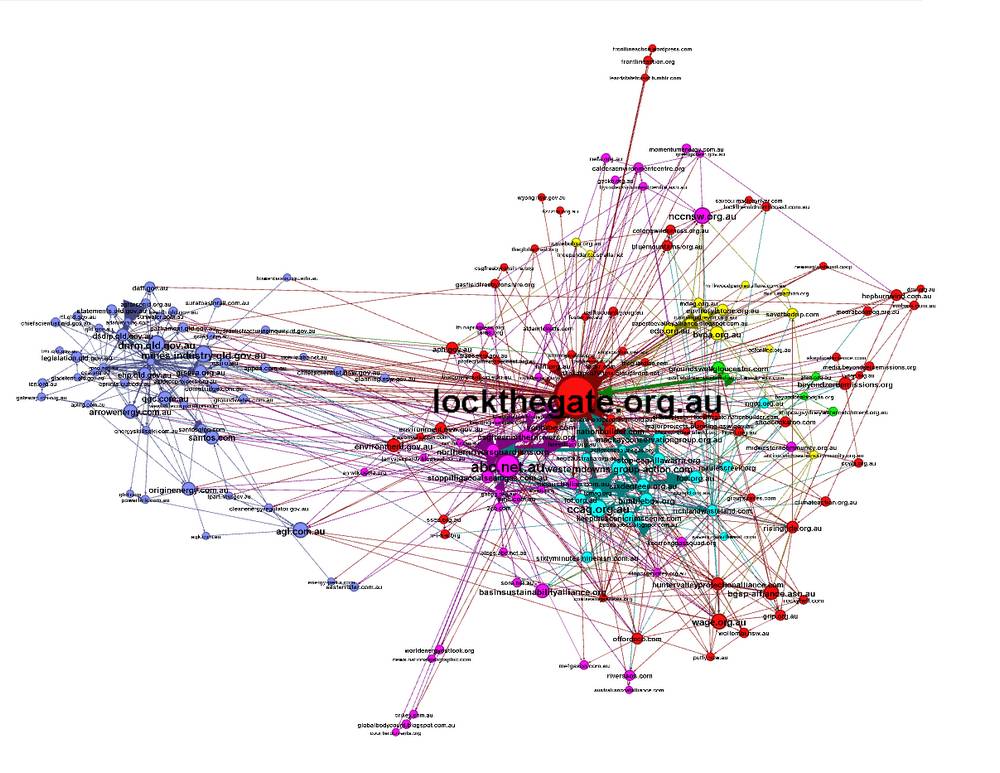
With the network flattened, the Force Atlas finally rendered something intelligible. However, the Yifan Hu layout, shown below, still gave a better result. The graph below also includes two other important changes. The nodes are now coloured according to ‘modularity classes’, which are natural clusters in the network that are identified by Gephi. And the nodes are now sized according to the in-degree (number of incoming links) of nodes in the flattened network, so that the measure reflects the number of sites linking to a node rather than the sum-total links from of individual pages.
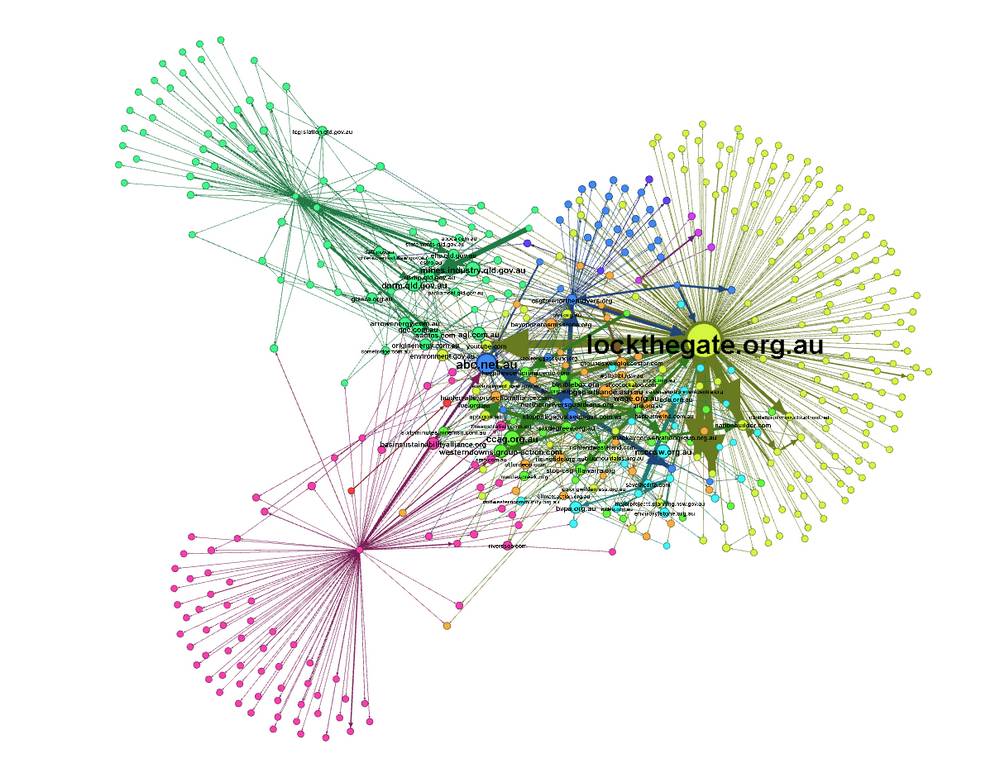
With the nodes thus resized, the most prominent site by far is lockthegate.org.au. This makes sense, given that Lock the Gate is the main lobby group in the anti-CSG campaign. It is something of a national umbrella group for the many smaller, community-based organisations that have mobilised against CSG development. Many of those groups are represented in the muddle of nodes and connectors immediately to the left of lockthegate.org.au.
Lock the Gate is one of four visible hubs on this graph from which many other nodes radiate. The other three hubs (though you can’t see their labels here) are gabpc.org.au (the Great Artesian Basin Protection Group), gasfieldscommissionqld.org.au, and csgfreenorthernrivers.org. Of these four hubs, only lockthegate.org.au has a large number of incoming links from other sites in the network.
Closer examination of the sites radiating from these four hubs (see the example below) reveals that many of them are of limited interest to this analysis. A good number of them are clearly not specific to CSG-related issues, but rather are unrelated businesses or general news outlets.
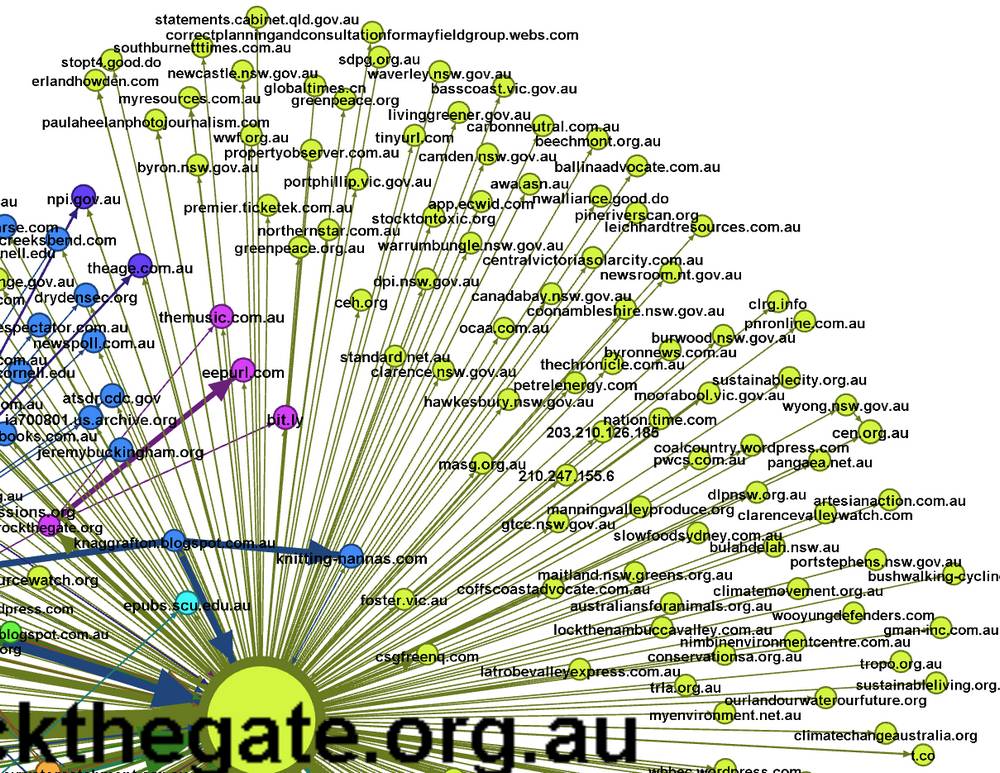
There is probably some useful information in these hangers-on, but for this exercise I decided to filter them out, producing the graph below. 2
A modular approach
The graph above is still a mess, I’ll admit. But Gephi provides a neat way to make sense of its complexity. The colours in this graph reflect natural groupings, or modularity classes, that have been identified by Gephi. By using a modularity class filter in Gephi, we can look at each individual class on its own. To some extent this is an artificial way of breaking up the network, because each node can only belong in one class, whereas in reality some organisations or websites could surely be placed in two or more classes at once. But let’s see what the results are anyway. To start with, here is the class that includes Lock the Gate:
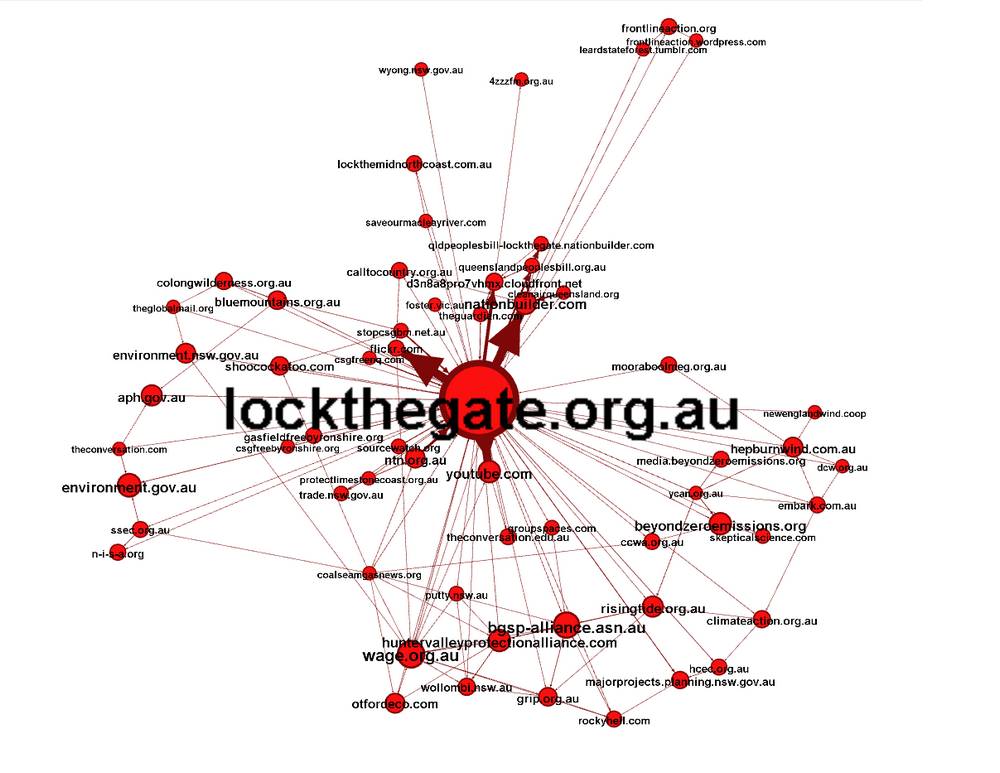
Along with Lock the Gate, various other CSG-related action groups are present in this class, such as Wollombi Valley against Gas Extraction (wage.org.au), the Hunter Valley Protection Alliance, Gasfield Free Byron Shire, and Lock the Mid-North Coast. Also present are some ‘higher-level’ environmental groups such as climateaction.org.au and beyondzeroemissions.org, as well as several government agencies. Interestingly, the majority of government agencies and community-based organisations in this group appear to be based in New South Wales. YouTube also features in this group, presumably because Lock the Gate uses it to promote their own videos.
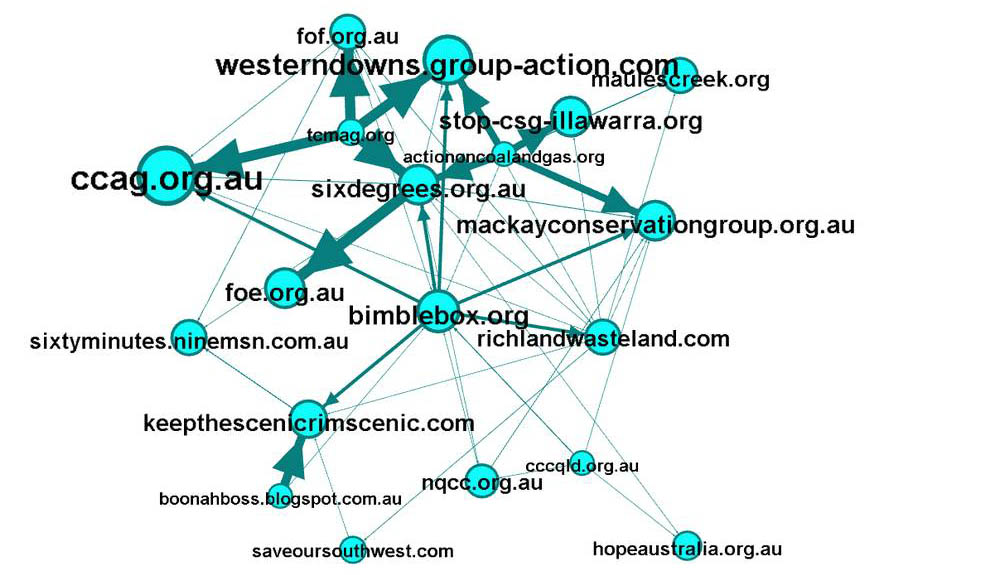
The next class in the network consists mostly of environmental and community-based organisations. Not all of them are concerned specifically with coal or CSG, but what is interesting is that most of them are based in Queensland. The Western Downs Action Group, the Mackay Conservation Group, Keep the Scenic Rim Scenic, the Capricorn Conservation Council (cccqld.org.au), the North Queensland Conservation Council, the Bimblebox Nature Refuge, the Boonah Organisation for a Sustainable Shire, the Friends of Felton, the Toowoomba Coal Mine Action Group, and Action on Coal and Gas, are all specific to parts of Queensland.
The next class identified by Gephi contains only five members. I am not sure why these have been separated from other parts of the network. However, it is worth noting that three of the groups are specific to the central coast area of New South Wales.

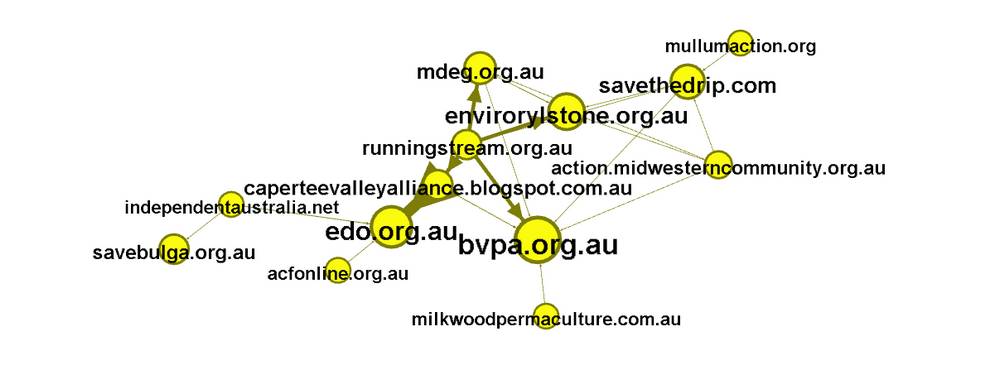
The next class also seems to be defined geographically, with the majority of the sites relating to areas in the ‘mid-western’ region of New South Wales, including Mudgee (mdeg.org, savethedrip.com), Rylstone, Running Stream, Capertee Valley, the Bylong Valley (bvpa.org.au) and Bulga.
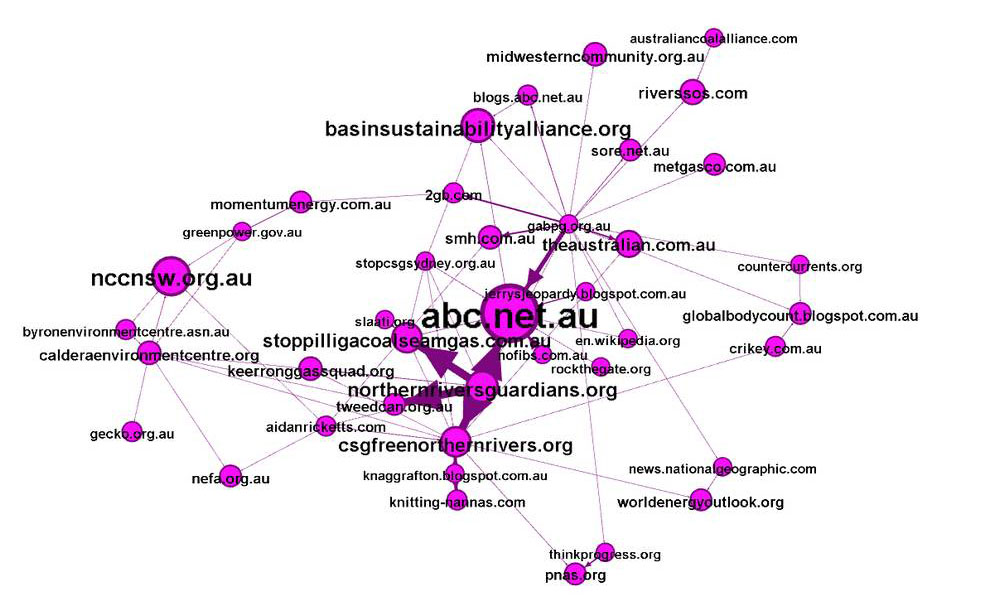
The next class is a bit of a mixed bag. Geographically, it includes several organisations representing parts of the Northern Rivers Region in New South Wales, including Byron Bay, Murwillumbah (Caldera Environmental Centre), Keerrong, the Tweed Valley, and Grafton. The North East Forest Alliance would fit into this region as well. Also present, however, is Stop Pilliga Coal Seam Gas, Stop CSG Sydney, and Sustainable Living Armidale, none of which relate to the Northern Rivers Region. There is also the Basin Sustainability Alliance, Save our Recharge Environment (sore.net.au), and the GABPG, all of which are concerned with the groundwater resources of the Great Artesian Basin. The ABC (Australian Broadcasting Corporation) has also ended up in this class, suggesting that it is a major information source for several other organisations in the class.
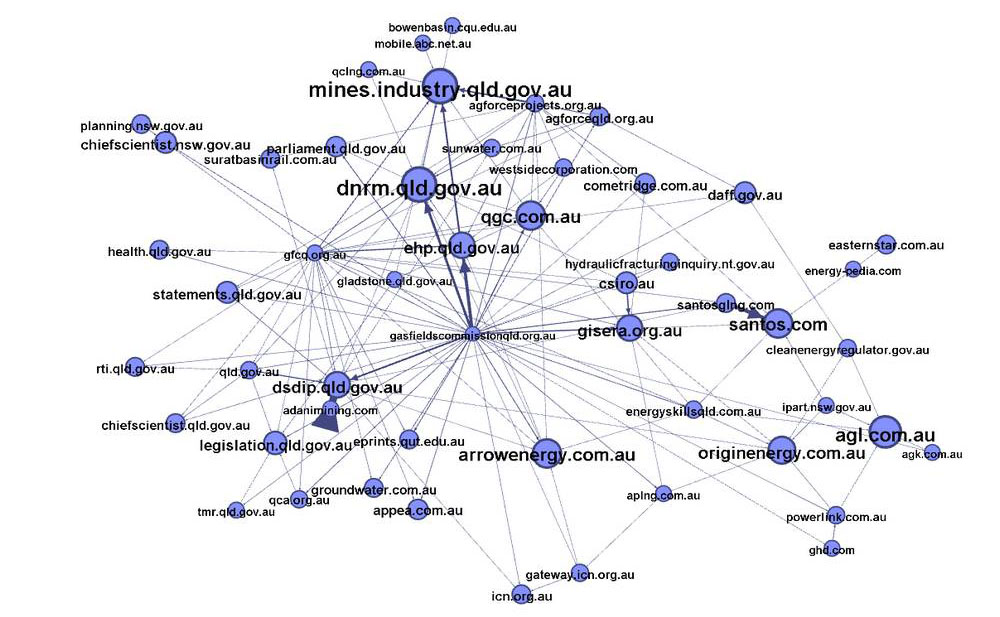
The final class in the network features a very different cast of organisations. Nearly all of them are government agencies or gas companies. It is hardly surprising that the regulator of the industry has ended up in the same network as the gas companies, as the websites of government agencies and the companies often link to one another when discussing project proposals and their assessments. At first glance, the central hub in this class looks to be the Queensland Gasfields Commission (represented as both gfcq.org.au and gasfieldscommissionqld.org.au). Interestingly though, very few sites link to the Gasfields Commission, even though it links to many others. Also worth noting in this graph is the presence of CSIRO and its affiliated organisation GISERA (Gas Industry Social and Environmental Research Alliance).
This experiment was a somewhat haphazard one, but I dare say it was a success. Although I never achieved a decent visualisation of the whole network, the analysis of individual classes identified by Gephi proves that there is indeed order buried within the chaos. Most notably, the analysis suggests that the online networks of community groups concerned about coal seam gas are defined primarily around geography. The internet may be a tool that transcends borders, but here it is being used to mobilise community action at a local level.
Co-links: a simpler option?
I have no doubt that more could be learned by exploring this network, but I will leave that for another day. Before finishing up, though, I’d like to compare this network to another one that I generated using Issue Crawler. The network below is the result of a co-link crawl, which constrains the number of sites in the network by retaining only those with incoming links from two or more other sites in the network. This increases the chances that every site in the network is relevant. I spent considerable effort filtering out unwanted sites in the network above, so it is worth checking to see if using a co-link crawl might have saved me the trouble.
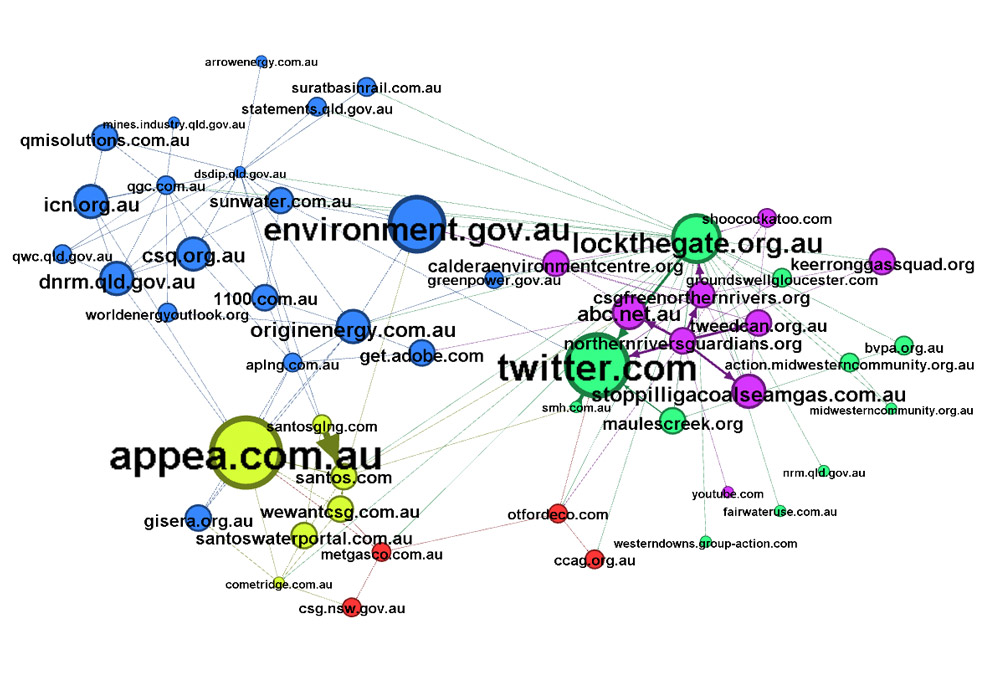
This certainly bears some resemblances to the previous network. As one would hope, many of the same community groups, gas companies and government agencies are here, and they are grouped even more clearly than in the previous network. For a high-level view, then, the co-link crawl does a good job. But this network omits some relevant organisations found in the previous one, and features some organisations that I don’t recall noticing before. I suspect, then, that the two networks tell somewhat different stories, and are suited to answering different questions. In future, I will be curious to perform another co-link crawl with more starting pages and a further iteration to see if I end up with a network that sits in the sweet-spot between too little detail and too much clutter.
Where to next?
I’ve already learned more from this exercise than I expected. I’ve got a pretty good list (though incomplete, I’m sure) of organisations talking about coal seam gas, and I have a rough idea of their regional networks. I will no doubt return to these organisational networks in the future, but the next logical step for me is to start looking at the substance of what these organisations have to say. Again, I am not intending to read all of their websites manually: I want the computer to do that for me too. And to do that, I am currently learning to use software that makes Gephi look like MS Paint. So the results might not come quickly, but I will do my best to make them interesting to look at.
In the meantime, I welcome any feedback on the analysis above. I’d be particularly keen to hear any additional or alternative interpretations of the graphs. If you are someone who is actively involved in the issue, do these networks reflect your own knowledge and experience? Are there any surprises? Are any important organisations or connections missing? Such feedback will be invaluable if and when this little experiment reaches Phase 2.
Notes:
- The starting points for my crawl were ‘links pages’ from the Basin Sustainability Alliance, the Great Artesian Basin Protection Group, the Queensland GasFields Commission, and the Lock the Gate Alliance ↩
- What I actually filtered out is any nodes with one or zero inlinks and zero outlinks. If you filter out just those nodes with one or zero inlinks (regardless of outlinks), you lose two of the most active outlink hubs on the graph — the Gasfields Commission, and the GABPG. These organisations appear to be highly active, and potential useful sources of information, but yet few other sites are actually linking to them. ↩