Tag Archives: text analysis

TweetKollidR – A Knime workflow for creating text-rich visualisations of Twitter data

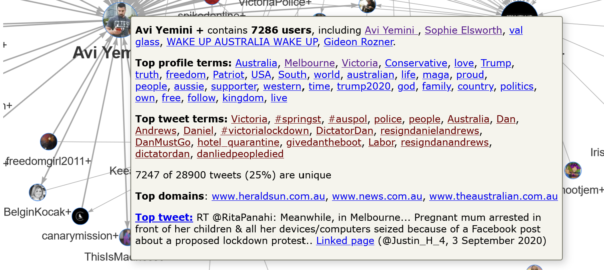
Several weeks ago, I posted an analysis of tweets about the restrictions imposed on Melbourne residents in an effort to control an outbreak of Covid-19. That analysis was essentially a road-test of a Knime workflow that I had been piecing together for some time, but that was not quite ready to share. Since writing that post, I have revised and tidied up the workflow so that anyone can use it, and I have made it available on the Knime Hub.

In the present post, I provide a thorough description of the workflow, which I have named the TweetKollidR, and demonstrate its use through a case study of yet another dataset of tweets about Melbourne’s lockdown (which, as I write this, still has not ended, although it has been eased). 1

Continue reading TweetKollidR – A Knime workflow for creating text-rich visualisations of Twitter data

Notes:

  1. As you will see from the search queries in Figure 3, this dataset includes some keywords that relate to Victoria more generally, rather than just Melbourne. However, since most of the content concerns the Melbourne lockdown, I will continue to refer to it as such.

Tweeps in lockdown: how to see what’s happening on Twitter

What we talk about when we talk about the lockdown

Back in January, I wrote a lengthy, data-driven meditation on the merits of my relocation from Brisbane to Melbourne. My concern at that time was the changing climate. Australia had been torched and scarred by months of bushfires, and I was feeling pretty good about escaping Brisbane’s worsening heat for Melbourne’s occasionally manic but mostly mild climatic regime.

But by gosh do I wish I was back in Brisbane now, and not just because Melbourne’s winter can be dreary. While Brisbanites are currently soaking up as much of their famed sunshine as they like, whether on the beach or in the courtyard of their favourite pub, Melburnians are confined to their homes, allowed out of the house for just an hour a day. During that hour, we are unable to venture more than 5km from our homes or to come within 1.5 meters of each other, leaving little else to do but walk the deserted streets and despair at all of the shuttered bars, restaurants and stores. All in the name of containing yet another existential threat that we can’t even see.

Of course, just because we can’t see the coronavirus doesn’t mean we can’t talk about it. Indeed, one unfortunate consequence of the ‘Stage 4’ lockdown 1 that’s been in place in Melbourne since the 2nd of August is that there is little else to talk about. We distract ourselves from talking about how bad things are by talking instead about how things got so bad in the first place. On days when our tireless premier (who at the time of writing has delivered a press conference every day for 50 days running) announces a fall in case numbers, we dare to talk about when things might not be so bad any more.

Fifty days and counting. Image from ABC News.

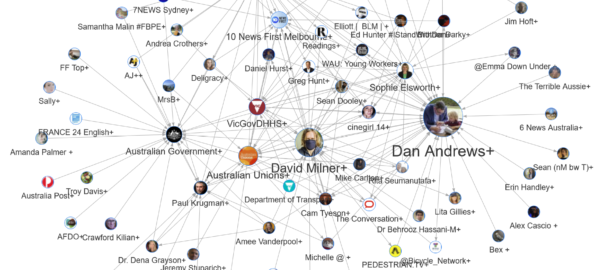
This post is anything but an attempt to escape this orbit of endless Covid-talk. Quite the opposite. In this post, I’m not just going to talk about the lockdown. I’m going to talk about what we talk about when we talk about the lockdown. Continue reading Tweeps in lockdown: how to see what’s happening on Twitter

Notes:

  1. To date, we’ve been from Stage 3 back to Stage 2, and then up again to Stage 3 before ratcheting up to Stage 4. Hopefully we’ll be back to Stage 3 in a few weeks. We keep using that word, but I don’t think it means what we think it means. If I lapse into calling it ‘Level 4’ instead, that’s why.

Free as in trams: using text analytics to analyse public submissions

The opportunity

As documented elsewhere on this blog, I recently spent four years of my life playing with computational methods for analysing text, hoping to advance, in some small way, the use of such methods within social science. Along the way, I became interested in using topic models and related techniques to assist the development of public policy. Governments regularly invite public comment on things like policy proposals, impact assessments, and inquiries into controversial issues. Sometimes, the public’s response can be overwhelming, flooding a government department or parliamentary office with hundreds or thousands of submissions, all of which the government is obliged to somehow ‘consider’.

Not having been directly at the receiving end of this process, I’m not entirely sure how the teams responsible go about ‘considering’ thousands of public submissions. But this task strikes me as an excellent use-case for computational techniques that, with minimal supervision, can reveal thematic structures within large collections of texts. I’m not suggesting that we can delegate to computers the task of reading public submissions: that would be wrong even if it were possible. What we can do, however, is use computers to assist the process of navigating, interpreting and organising an overwhelming number of submissions.

A few years back, I helped a panellist on the Northern Territory’s Scientific Inquiry into Hydraulic Fracturing to analyse concerns about social impacts expressed in more than 600 public submissions. Rather than manually reading every submission to see which ones were relevant, I used a computational technique called probabilistic topic modelling to automatically index the submissions according to the topics they discussed. I was then able to focus my attention on those submissions that discussed social impacts, making the job a whole lot easier than it otherwise would have been. In addition, the topic model helped me to categorise the submissions according to the types of social impacts they discussed, and provided a direct measurement of how much attention each type of impact had received.

This experience proved that computational text analysis methods can indeed be useful for assessing public input to policy processes. However, it was far from perfect case study, as I was operating only on the periphery of the assessment process. The value of computational methods could be even greater if they were incorporated into the process from the outset. In that case, for example, I could have indexed the submissions against topics besides social impacts. As well as making life easier for the panellists responsible for other topics, a more complete topical index would have enabled an easy analysis of which issues were of most interest to each category of stakeholder, or to all submitters taken together.

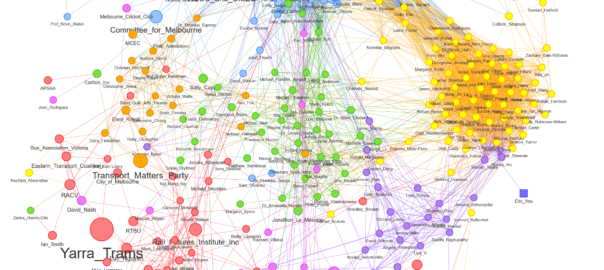
In this post, I want to illustrate how topic modelling and other computational text analysis methods can contribute to the assessment of public submissions to policy issues. I do this by performing a high-level analysis of submissions to the Victorian parliament about a proposal to expand Melbourne’s ‘free tram zone’. I chose this particular inquiry because it has not yet concluded (submissions have closed, but the report is not due until December) and because it received more than 400 hundred submissions, which although perhaps not an overwhelming number, is surely enough to create a sense of foreboding in the person who has to read them all.

This analysis is meant to be demonstrative rather than definitive. The methods I’ve used are experimental and could be refined. More importantly, these methods are not supposed to stand on their own, but rather should be integrated into the rest of the analytical process, which obviously I am not doing, since I do not work for the Victorian Government. In other words, my aim here is not to provide an authoritative take on the content of the submissions, but to demonstrate how certain computational methods could assist the task of analysing these submissions. Continue reading Free as in trams: using text analytics to analyse public submissions

TroveKleaner: a Knime workflow for correcting OCR errors

In a nutshell:

  • I created a Knime workflow — the TroveKleaner — that uses a combination of topic modelling, string matching and other methods to correct OCR errors in large collections of texts. You can download it from the KNIME Hub.
  • It works, but does not correct all errors. It doesn’t even attempt to do so. Instead of examining every word in the text, it builds a dictionary of high-confidence errors and corrections, and uses the dictionary to make substitutions in the text.
  • It’s worth a look if you plan to perform computational analyses on a large collection of error-ridden digitised texts. It may also be of interest if you want to learn about topic modelling, string matching, ngrams, semantic similarity measures, and how all these things can be used in combination.

O-C-aarghh!

This post discusses the second in a series of Knime workflows that I plan to release for the purpose of mining newspaper texts from Trove, that most marvellous collection of historical newspapers and much more maintained by the National Library of Australia. The end-game is to release the whole process for geo-parsing and geovisualisation that I presented in this post on my other blog. But revising those workflows and making them fit for public consumption will be a big job (and not one I get paid for), so I’ll work towards it one step at a time.

Already, I have released the Trove KnewsGetter, which interfaces with the Trove API to allow you to download newspaper texts in bulk. But what do you do with 20,000 newspaper articles from Trove?

Before you even think about how to analyse this data, the first thing you will probably do is cast your eyes over it, just to see what it looks like.

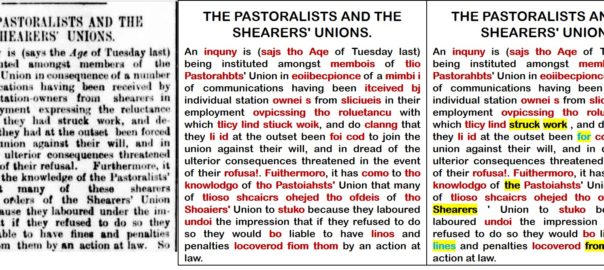
Cue horror.

A typical reaction upon seeing Trove’s OCR-derived text for the first time. Continue reading TroveKleaner: a Knime workflow for correcting OCR errors