Tag Archives: data visualisation

The bottom-right cluster. All of these documents except Submission 0655 draw on the same template.

Using Junk words to find recycled text

Newton’s third law of motion — that for every action, there is an equal and opposite reaction — would appear to apply to the coal seam gas industry in Australia. The dramatic expansion of the industry in recent years has been matched by the community’s equally dramatic mobilisation against it. As my previous post showed, there are literally dozens of organisations on the web (and probably even more on Facebook) concerned in some way with the impacts of coal seam gas development. Some of these are well-established groups that have incorporated coal seam gas into their existing agendas, but many others seem to have popped up out of nowhere.

Most of these groups could be classified as community organisations insofar as they are concerned with a specific region or locality. But to think of them all as ‘grassroots’ organsiations, each having emerged organically on its own accord, might be a mistake. As the website network in my last post suggests, many of these groups might better be thought of as ‘rhizomatic’ (or lateral) offshoots inspired by the Lock the Gate Alliance. Lock the Gate emerged in 2010 and quickly reconfigured the landscape of community opposition to coal seam gas. Its campaigns, strategies and symbolism provided a handy template upon which locally focussed organisations could form. You’ll be hard-pressed to find a community-based anti-CSG group without a link to Lock the Gate on their website.

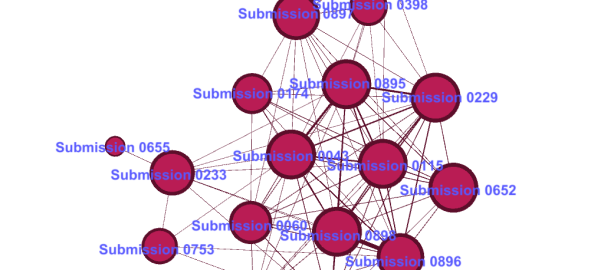
The lesson here is that voices that appear to be independent may to some extent be influenced or assisted by a small handful of highly motivated (or well resourced) groups or individuals. Having observed this possibility in the network of anti-CSG websites, I recently encountered it again while sifting through a very different dataset that I am preparing for  textual analysis. The dataset in question is the 893 public submissions that the Parliament of New South Wales received in response to its 2011 inquiry into the environmental, health, economic and social impacts of coal seam gas activities. The submissions came from all kinds of stakeholders, including community groups, gas companies, scientific and legal experts, government agencies, and individual citizens. Of particular interest to me were the 660 submissions from individual citizens. Here was a sizable repository of views expressed straight from the minds and hearts of individual people, undistorted by the effects of groupthink or coordinated campaigns. Or so I thought. Continue reading Using Junk words to find recycled text

Queensland’s Groundwater Database – The Movie!

(Just want to see the movies? Click here.)

Every bore is sacred

In Queensland, as in much of Australia, water is a scarce resource. Except in the monsoonal north, the annual rainfall tends to range from low to unreliable. Good years follow bad years; droughts follow floods. The continued availability of water for human use and environmental health cannot be taken for granted: it must be planned for. In Australia, the responsibility for this planning rests with the state and territory governments.

When I joined Queensland’s Department of Natural Resources 1 in 2006, the state’s surface water resources (rivers and overland flows) were pretty well accounted for. Water resource plans — the state’s legislative instrument for allocating water among competing uses — had been prepared for nearly every river basin in the state. The department was now grappling with the more difficult task of accounting for the state’s groundwater.

In many parts of Queensland, underground reservoirs (or aquifers) are the only reliable source of water. Across much of the state’s arid interior, human settlement and agricultural activities would be virtually impossible without water from the Great Artesian Basin — an enormous sequence of aquifers that underlies much of the eastern half of the country. Closer to the surface, there are numerous alluvial aquifer systems — the most significant being the alluvium of the Condamine River in the Darling Downs — which support regional towns and intensive irrigation districts.

The Great Artesian Basin.
The extent of the Great Artesian Basin (Image source: Wikipedia, contributed by Tentotwo.

Over the past century, many groundwater systems in Queensland have effectively been ‘mined’ as water has been taken at a rate faster than it is naturally replenished. Drastic reductions in water use from these systems have been (and are still being) enacted to return water extraction to within sustainable limits.

However, determining what these limits are is no trivial task. The workings of groundwater systems are largely hidden from view, and the only way to develop a picture of them is to drill holes in the ground and piece together the observations taken at each one. I remember a groundwater engineer in the department likening this process to punching holes into a book and reconstructing the plot by studying the confetti. That analogy might be a slight exaggeration, but it does illustrate why every hole drilled, and every bit of data collected, is so precious. We can really only guess at how a groundwater system works, and sometimes the data from a single hole will make all the difference between a good guess and a bad one. Continue reading Queensland’s Groundwater Database – The Movie!

Notes:

  1. The department wasn’t actually called this in all the time it was there, but for the sake of simplicity, that is what I am calling it here!