Long, long ago, I studied music. In fact, when I finished high school, music was all I wanted to study. To be sure, I didn’t just want to study it: I wanted to compose it as well. 1 But I soon discovered that music theory was something worthy of study in itself, quite apart from the grounding it provided for composition. Music theory, especially the analysis of harmonies and harmonic progressions, provided a way to pop the hood on a piece of music (or even a whole genre) and learn what makes it tick. As if that weren’t exciting enough, I sensed that there were more profound truths waiting to be teased out of these harmonic structures. For if they offered clues about what makes music tick, then surely they said something about what makes us tick as well.
I never did pursue my vision of a grand unified theory of tonal harmony and psychoacoustics. I soon found that there were also other things worth studying, many of which came with the bonus incentive of career prospects. One thing led to another, and for better or worse, I ended up working for the government. And not as a music theorist. But to this day, I can’t help hearing a piece of music and thinking about what makes it tick. The theorist within me is always plugging away, even while the rest of me is just enjoying the tune.
Unsurprisingly then, when I started playing with network graphs about 18 months ago, among the first things I asked myself is what application they might have for music theory. The beauty of network graphs is that they can be used to represent just about anything. Any system or community of inter-related parts can be turned into a network of nodes and connections. So far on this blog I’ve used network graphs to explore the linkages among websites related to coal seam gas, and to identify clusters of documents containing duplicated text. On my other blog, I used network graphs to see how the names of different people and places featured across a collection of my posts.
In this post, I will use network graphs to visualise the relationships among chords within a piece of music. You could examine melodies in much the same way, by breaking them down to their individual notes and tracking which notes pair up and cluster together most often. But I suspect that there is more to be gained from visualising the harmonic relationships.
I am not calming to be the first person to have done this, but the cursory internet search that I performed a bit more than a year ago, when I first developed these graphs, 2 didn’t uncover anything using this particular approach (though admittedly I didn’t trawl the academic literature). The closest thing I found was hooktheory.com, which has a neat chord progression ‘explorer’ that is arranges chords in a network (at least it used to: I can’t seem to find that particular feature on the website anymore), but does not appear to represent individual songs in the way that I have done.
I created the graphs below with the network visualisation software Gephi. The ‘coding’ (really just tabulation) of the songs into the Gephi format was done with the assistance of an Excel spreadsheet. For the pop songs, which generally have one definitive recording, I have generally relied on my own interpretation of the chords when listening to the recording. For the two jazz songs, of which there are many recordings, all with different harmonic variations, I have used a published songbook, 3 though with some simplifications to facilitate comparisons between songs.
But enough talk. On with the pictures.
Welcome to the Hotel California
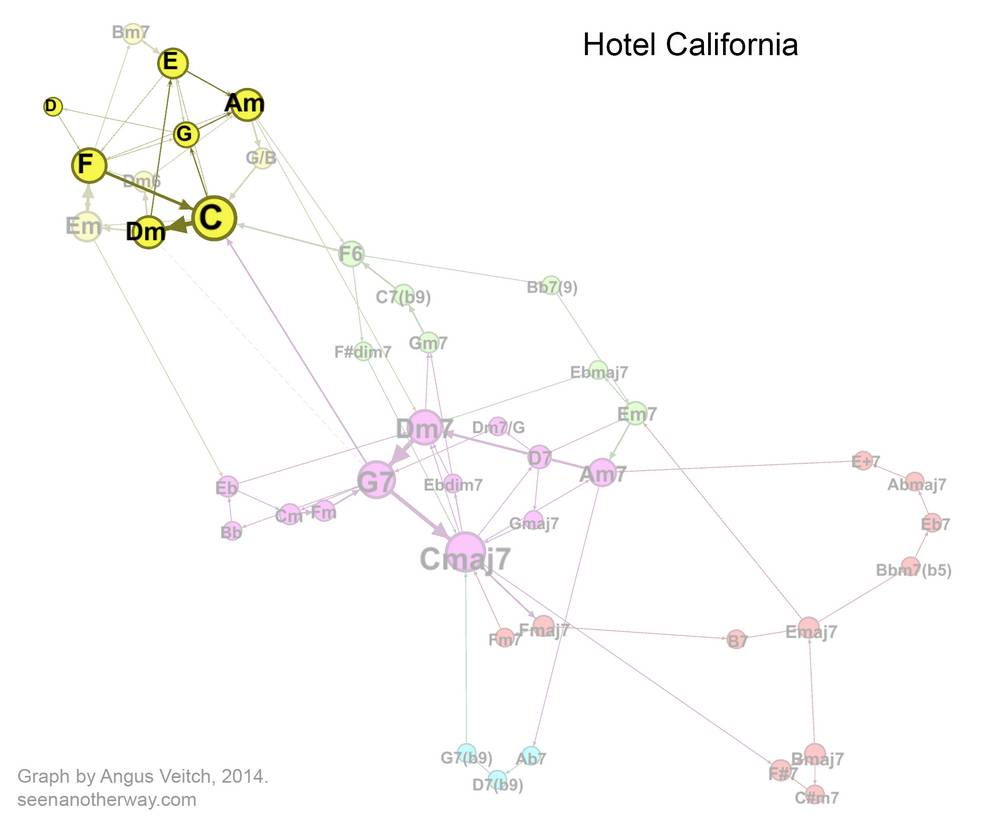
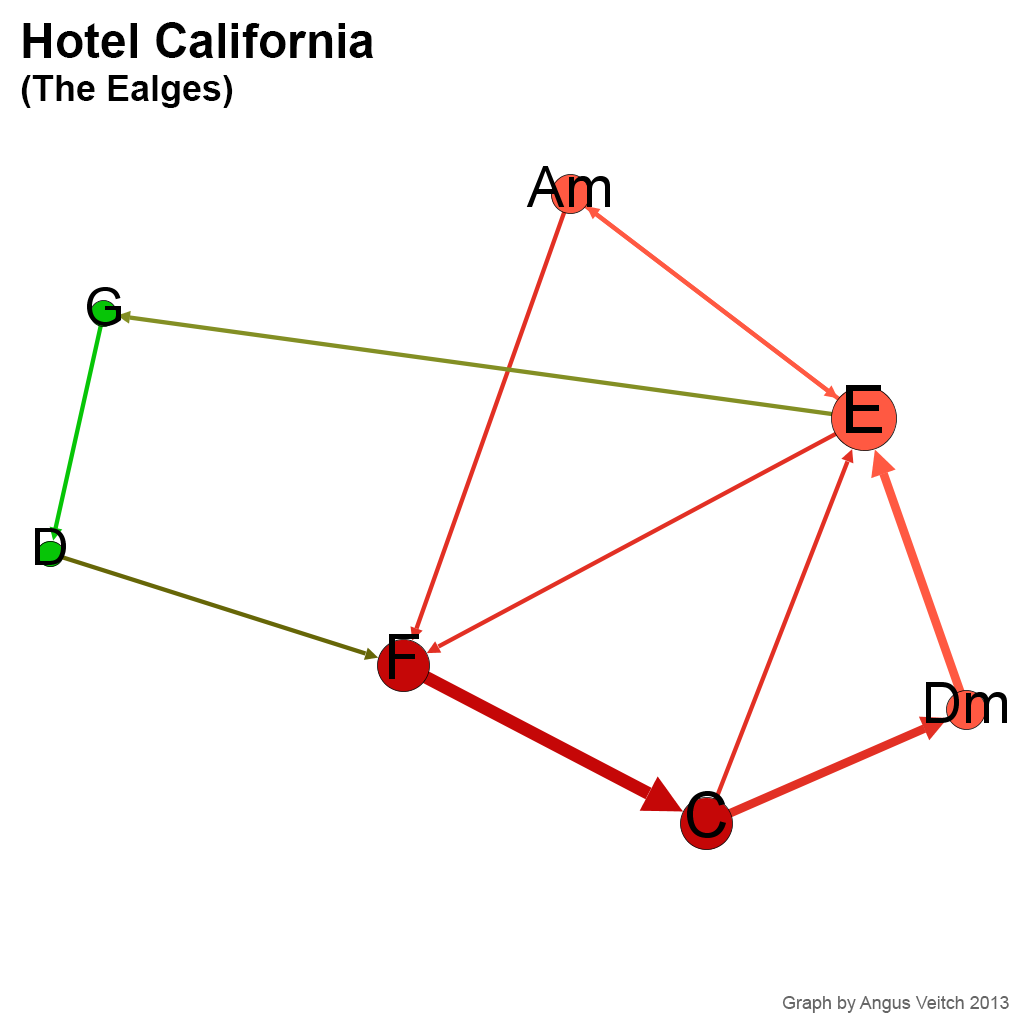
Let’s start with a relatively simple pop song: ‘Hotel California’ by The Eagles. Just to confuse people who know how to play the song, I have transposed it so that it starts on Am instead of Cm. (Actually, the reason for me doing this this will become clear later on).
Each dot, or node, in this network represents a chord. Two chords are joined in the network if they occur sequentially in the song, with the arrowheads on the connectors indicating the order in which the paired chords occur. (A connector pointing in both directions indicates that each of the two chords precedes the other at some point in the song.) The size of a node reflects how often the chord occurs, 4 and the thickness of a line indicates how frequently two chords are paired (regardless of direction). If you are confused, then this animated version might make things a little clearer.
You can see from the video that there is one ‘loop’ of chords for the verse (Am, E, G, D, F, C, Dm, E) and another for the chorus (F, C, [Dm], E, Am). One sequence (F, C, Dm, E) is shared by both of these loops, so the nodes representing these chords are relatively large, and their connections stronger than the others. In contrast, the chords G and D occur only in the verse, and only via one pathway, so they are relatively small and separate from the rest of the network.
Here, there, and everywhere
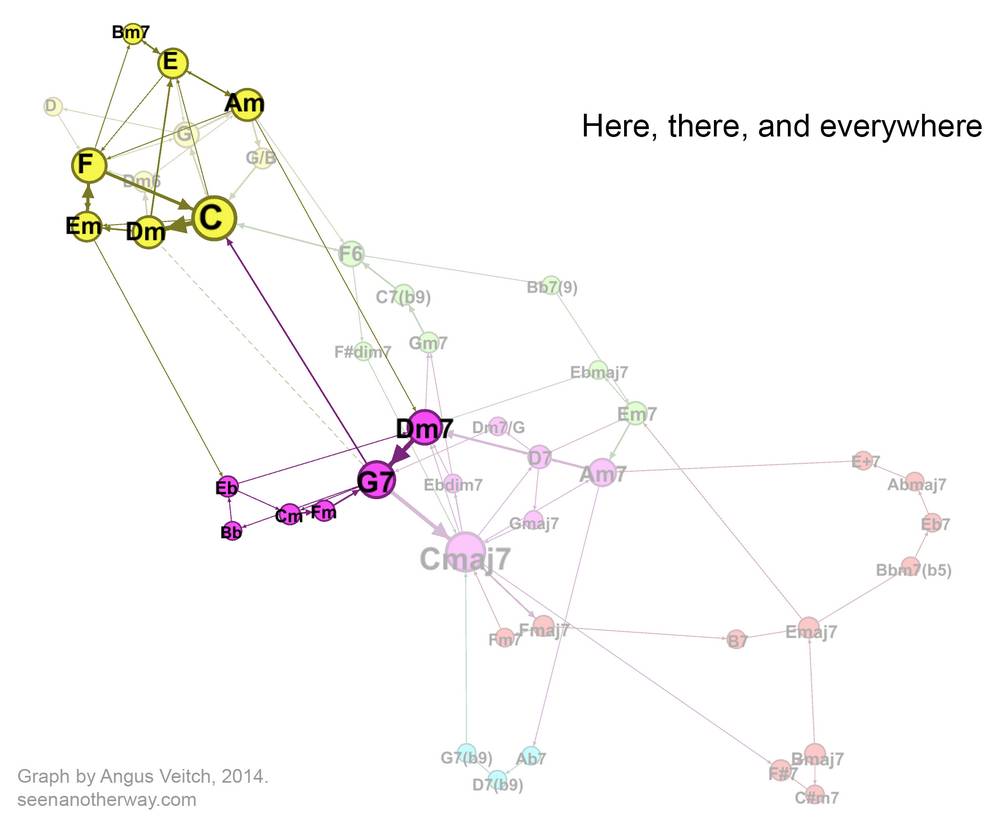
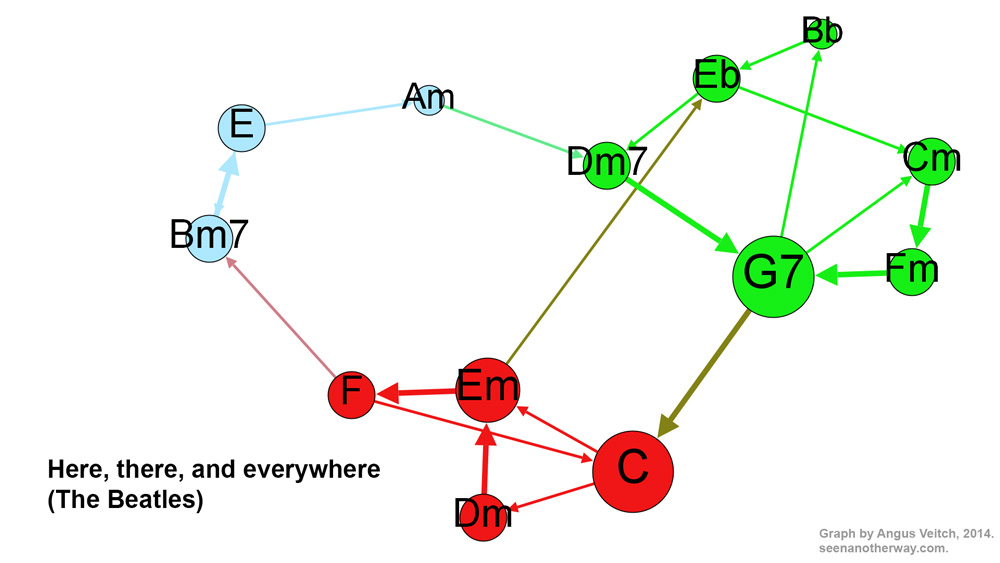
Now let’s look at a more adventurous pop song: ‘Here, there, and Everywhere’ by the Beatles.
Whereas ‘Hotel California’ comprised two intersecting loops, this song emerges as three distinct clusters. At the bottom of the graph, coloured red, is the climbing chord sequence of the verse (C, Dm, Em, F), which repeats once before the surprise entrance of Bm7, which tic-tacs with E before resolving to Am, the relative minor of C. A smooth turnaround via Dm7 and G7 takes us back to C for the second verse.
At the end of the second verse, things change. The G7 does not resolve to C, but instead, jumps to Eb (“I need her everywhere…”) via a very brief Bb chord. We are now in a different key, and a different part of the graph. As the song moves through Fm and G7 back to Cm, it becomes clear that we are in C minor, the parallel minor mode of the song’s tonic key. After looping through these chords once more, we are thrown back into the major mode via G7 (the dominant seventh of both C major and C minor), and the third verse begins.
Besides the dominant-tonic relationship of G7 and C, there is one other connection between the major and minor mode (red and green) clusters. In the introduction of the song, the Em chord moves to Eb, which in turn moves to Dm7. Next to the Em, the Eb chord sounds colourful indeed. But rather than calling it exotic, you could say that it has just been borrowed from another part of the song. So it is more than merely decorative: it is a sneak-preview of of the harmonic journey that is to come. Clever Beatles!
Fish gotta swim
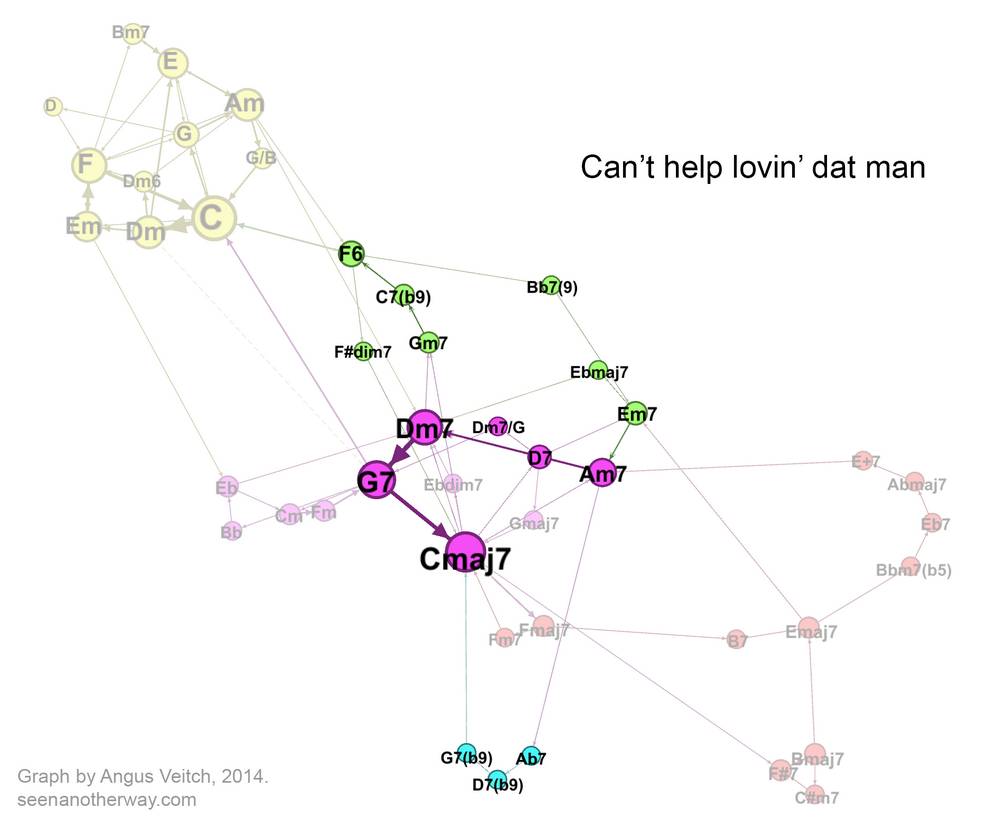
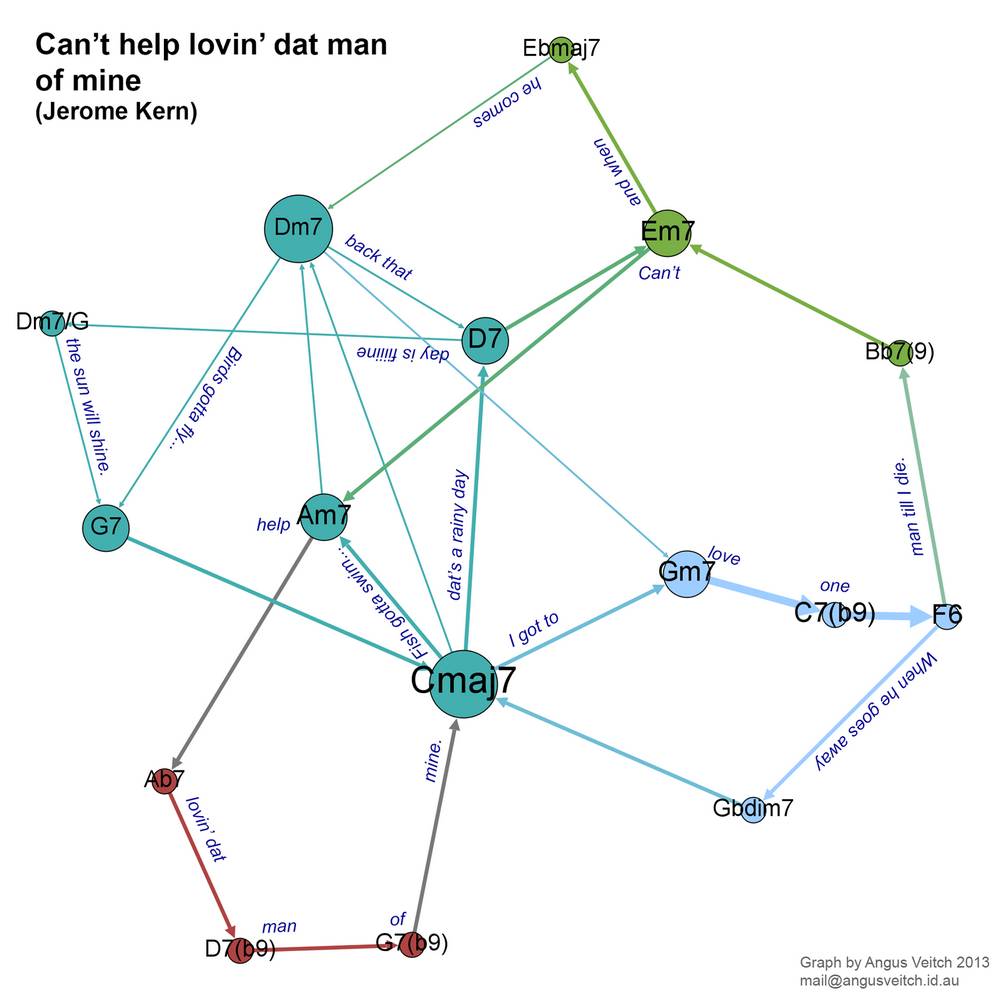
Bits of ‘Here, there, and everywhere’ sound almost like jazz (to me, anyway). But now we are going into real jazz territory with the jazz standard, ‘Can’t help lovin dat man of mine’, composed by Jerome Kern. I haven’t gotten around to making a video for this song, so as a compromise I have included some of the lyrics (which are by Oscar Hammerstein) on the graph. (On the bright side, your neck will get some exercise.) You’ll find lots of versions of this song on Youtube, but this one by Ella Fitzgerald is as good as any (note that there is an introductory section lasting until about 1:30).
The song begins (‘Fish gotta swim…’) with a standard jazz progression: C, Am7, Dm7, G7, then moves to F6 and Bb7(9) by way of the Gm7-C7b9 ‘turnaround’. The refrain (‘Can’t help…’) uses the colourful sequence Ab7, D7b9, G7b9 to get back to Cmaj7. If I did this again, I would have notated the G7b9 as G7 to make the network a bit more parsimonious.
One feature of this graph, compared with the previous two, is that there is a greater variety of pathways leading from the tonic (Cmaj7) and back again. You can ‘choose your own adventure’ in a way that you can’t do with the two pop songs. Arguably, I have exaggerated this effect somewhat by separating what are essentially different flavours of the same chords (such as G7b9 as G7); but the fact that there are similar pathways with different flavours is itself an interesting feature of the song (or this version of it, anyway).
All the things you are
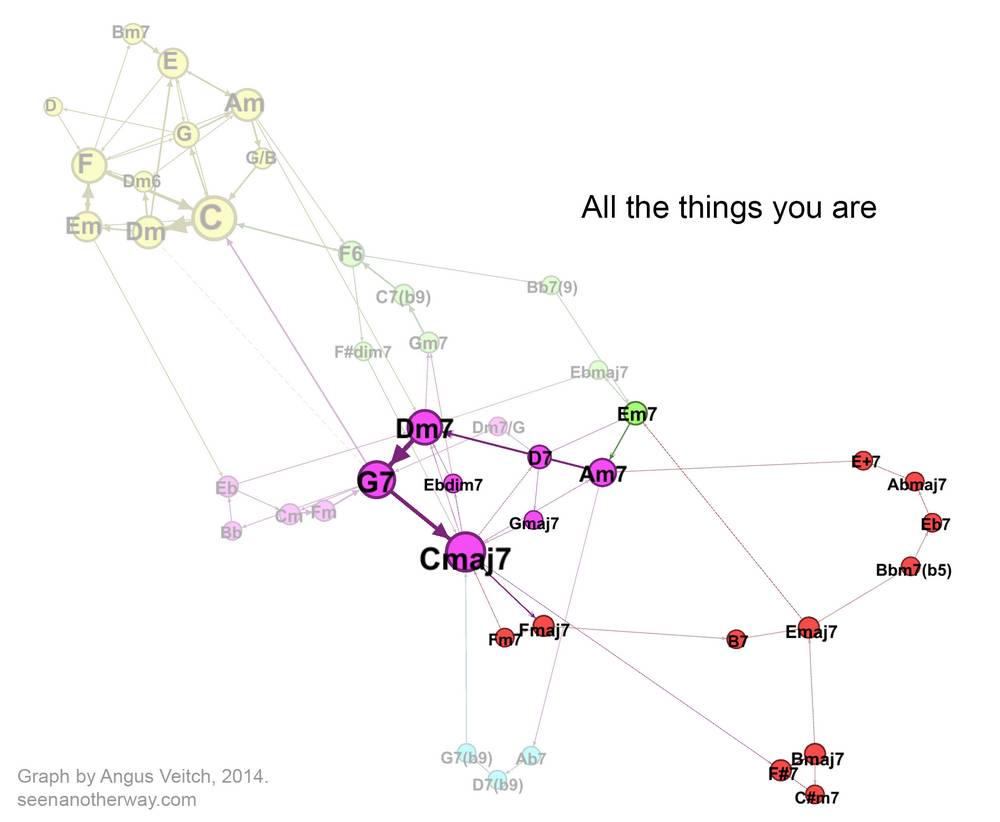
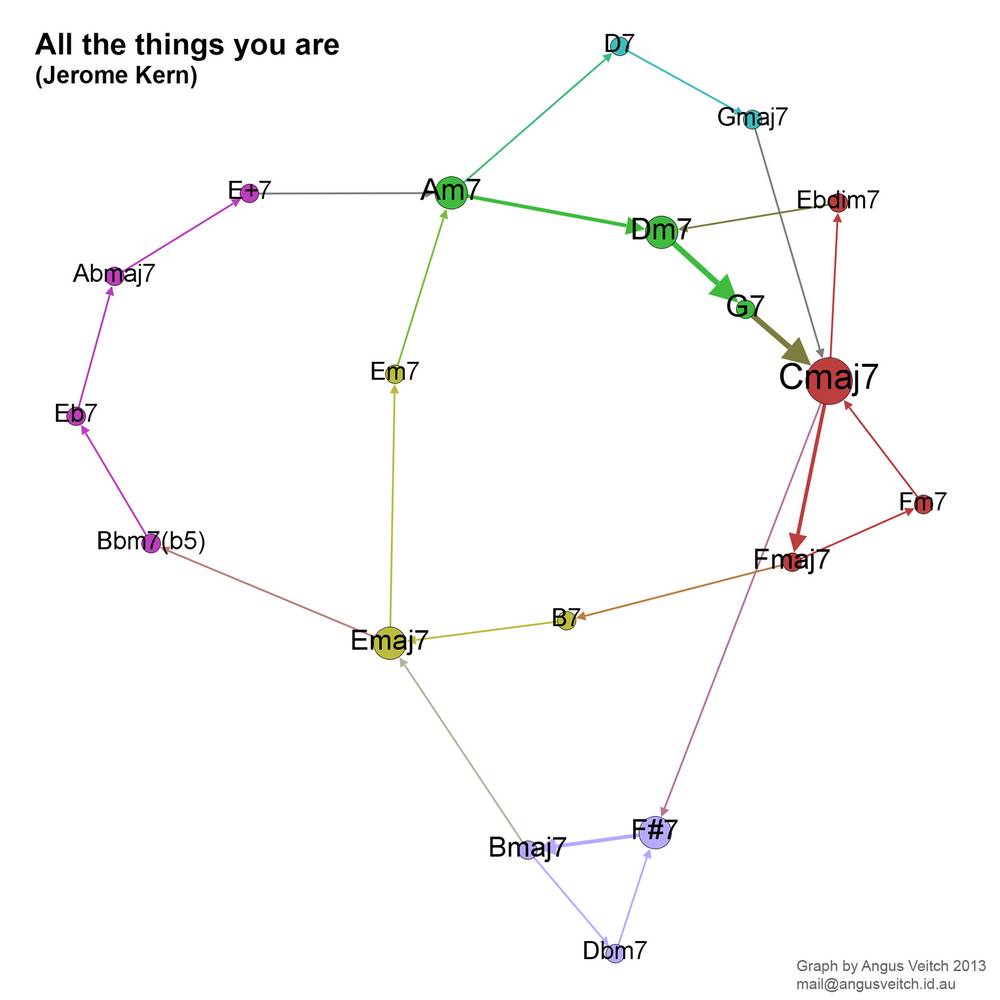
The next and final song has a still more expansive network, but one that is also rather beautiful. ‘All the things you are’, another song by Jerome Kern, is famous for the long but tuneful journey it takes through several different keys. The graph below shows the ‘circles of fifths’ (an expression that is usually figurative, but in this case is literal) through which this journey is achieved. The song begins on Am7 and finishes on Cmaj7. I highly recommend watching the video.
I could analyse this song further, but I don’t feel the need to, because the graph encapsulates its harmonic structure so elegantly. More so than with the other three songs, I feel that this graph captures a defining aspect of the song — one that perhaps couldn’t be seen any other way. You could say that graph reveals the song’s harmonic shape, or perhaps more precisely, its topology. There are not many other ways in which you could sensibly draw it.
You may well ask — of what theoretical or practical value is a song’s harmonic topology? I honestly don’t know. It sure looks interesting though.
The whole harmonic space
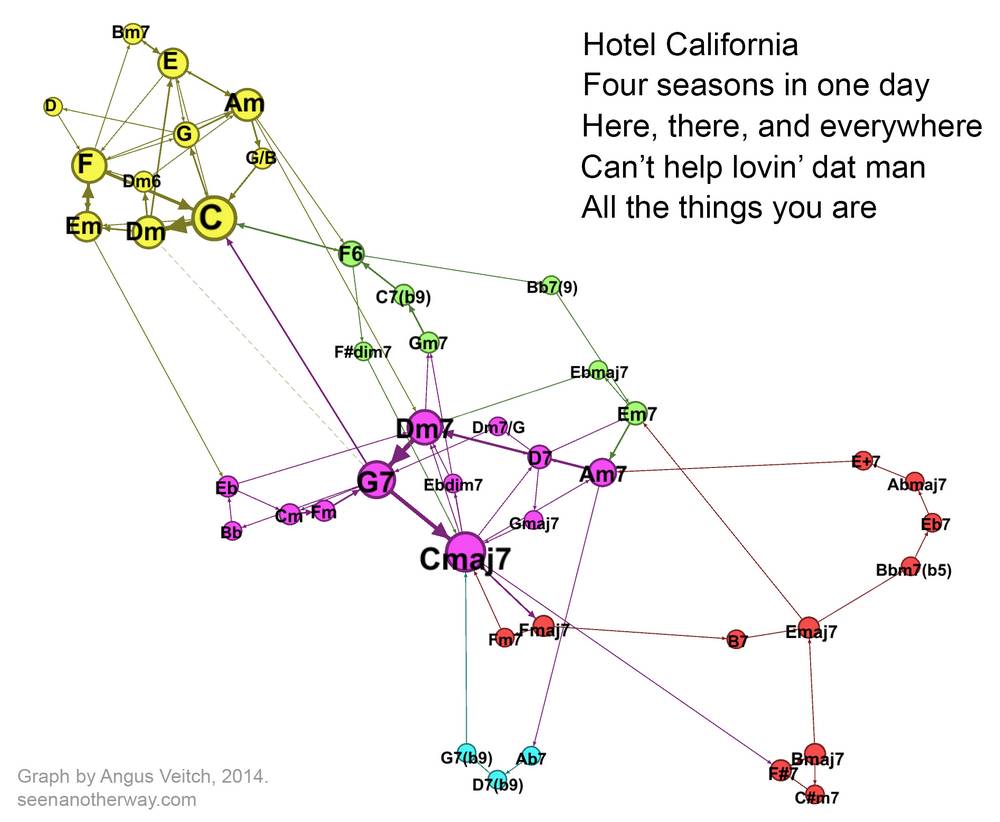
We’ve now looked at four songs and compared their individual networks. What would happen if we combined them all into one big network? This is exactly what I have done below, albeit with the addition of a bonus song: ‘Four seasons in one day’ by Crowded House.
What you see here is the harmonic ‘space’ occupied by all five songs. As we will see, each song occupies a specific portion of this space, with some songs occupying more space than others, and some pairs of songs sharing more space than others. The colours, by the way, do not demarcate the individual songs but rather, as before, indicate natural clusters of closely related chords. Let’s see where each song sits within the space.
Here is Hotel California, which occupies just one well-defined region of the graph. If you hover your cursor over the image (or touch it if you are on a mobile device), you will see the chords for ‘Four seasons in one day’. This song uses many of the same chords as ‘Hotel California’, but with a few more added in, including one chord (F6) which joins it to a part of the space defined by ‘Can’t help lovin’ dat man’.
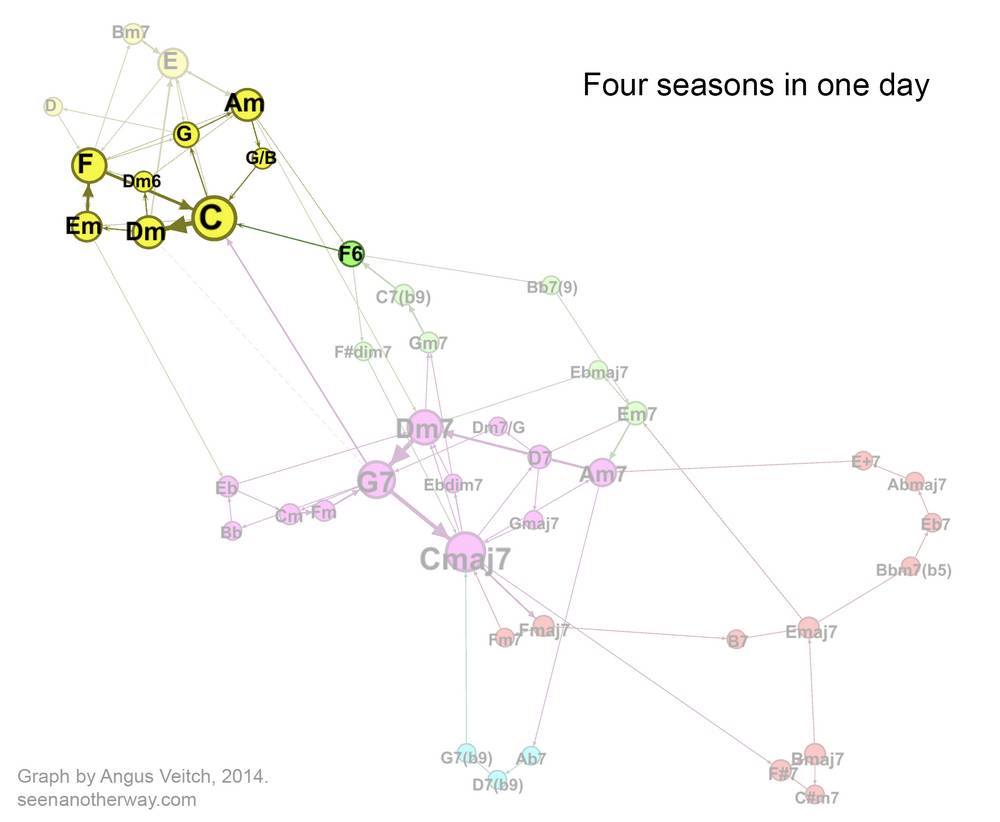
You can see now why I transposed all of the songs into C major. Putting songs in the same key makes them more comparable in terms of the function (rather than the identity) of their chords. 5 It’s a bit like the process of ‘normalising’ two sets of numbers according to their maximums or averages so that their statistical distributions can be compared. As with the sets of numbers, however, there is sometimes more than one way to ‘normalise’ the chords of different songs, and the approach that is chosen will affect the comparisons that are subsequently made.
For example, should I have transposed ‘Hotel California’ in the way that I did so that its chorus is in C major, making it directly comparable with other songs in major keys; or should I have left it alone so that its verse begins in C minor, making it more comparable with songs that are squarely in a minor key? Or does it make sense to use A minor as the default or ‘baseline’ minor key, so that shifts to and from the relative major (a common technique, especially in pop songs) can be followed easily?
And when comparing songs that use simple, unadulterated harmonies (typical of pop) with songs using more colourful, extended harmonies (typical of jazz), how many species of embellishments should be recognised? Do you distinguish between G and G7? Between G7 and G7b9? Between G7b9 and G79add13? I think the answers to these types of questions depend on what specific features and genres are being compared, and on the ultimate objectives of the analysis.
Anyway, I digress. Let’s get back to seeing where the individual songs fit in the collective harmonic space. As I mentioned before, ‘Here, there and everywhere’ is a bit more adventurous than the other pop songs, so it acts as a sort of bridge to the songs with more exotic chords. As the composite image below shows, it connects up with the jazzy region of the graph via its use of Dm7-G7, which, when followed by a C (or a Cmaj7), are probably the two most important chords in all of jazz.
With ‘Can’t help lovin dat man’ (which appears when you hover over or touch the image below), we are firmly into jazz territory (the giveaway is that every chord is adorned with a 7 at the very least).
Finally, the image below compares ‘Can’t help lovin’ dat man’ with the other jazz song, ‘All the things you are’ (again, you need to hover over or touch the image to see the second song). The songs occupy much of the same jazz space, but ‘All the things you are’ also stakes out a sizable territory of its own thanks to the distant keys that it traverses. You could add many more songs (even jazz ones) before one of them makes a shared claim to these exotic parts of the graph.

A harmonic universe?
The harmonic space shown above, comprising just five songs, is not very impressive. But I hope it is enough to convey the concept I am suggesting. If you did this exercise with a greater number of songs — and I’m thinking hundreds or even thousands — you could map out a much more comprehensive harmonic space than what I have achieved here. Within this space you could locate and compare not just individual songs, but also whole genres or oeuvres. In principle, you could even map the entire harmonic universe of tonal music. All you need is a very big database of songs. In practice, of course, you might get bogged down in the sorts of quandaries I outlined earlier, as no single system is likely to be suitable or convenient for all kinds of music. But the journey would be an interesting one to make.
What would be gained by doing this? Other than creating a novel communication or education tool, I’m not really sure. I think the usefulness or otherwise of mapping a more fulsome harmonic space can’t really be judged until someone gives it a try. But no, I am not putting up my hand to do it! Among other things, there is a PhD that I am supposed to be working on. And no, I’m not doing my PhD about this. But you are very welcome to do so!
Notes:
- Eventually, years later, I did get around to writing some music. And I have finally published some of the results onto Youtube. ↩
- I produced most of the graphs in this post in November 2013 and posted them in a Facebook album. ↩
- Paperback Song Series: Jazz Standards, published by Hal Leonard Corporation. ISBN 0-7935-8872-3. ↩
- Or at least, it is supposed to. I have a sneaking suspicion that in this particular case, the node sizes reflect the number of different unique chords that connect to the chord in question. ↩
- Generally in music theory, the functional role of chords is conveyed by notating the chords as numbers (typically Roman numerals) that correspond with the scale degree of the root of the chord. So, for example, C-F-G in C major, and D-G-A in D major would both be notated as I-IV-V. I thought about using Roman numerals for this exercise, but decided that it would be just too hard. Among other things, I wouldn’t know how to get programs like Excel and Gephi to display the notation satisfactorily. ↩
Hi Angus
I enjoyed the diagrams – a neat way to visualise the songs.
Coincidentally today I came across a reference in my notes to the work of JoAnn Kuchera-Morin which seems to be aligned with your thoughts
If you haven’t come across her already, check out her work in this ted talk
http://www.ted.com/talks/joann_kuchera_morin_tours_the_allosphere
Cheers Bev
Hi Angus, Interesting thoughts and graphs! I am an “intermediate level” jazz guitar player, struggling to understand functional relationships among jazz chords. If I would have to point out one of the issues confusing me at present is the multiple names used to identify the same chord, and the multiple functions and equivalences (eg maj7 = rootless min9…). I guess this sensation of despair may alleviate with a lot of time, practice, and patience. In the meantime, mind searchs for images, mnemonic devices to quickly grasp chord variants/options. I thought it may be graphical ways to quickly depict different possibilities or variations related to a certain chord. I mean, if I think in a maj7 chord, how many possibilities or variations are, in terms of positions in the neck, inversions, substitutions, rootless chords, etc? I have the impression that connecting related chords will give rise to some kind of network, and maybe network analysis could emerge as a novel approach to grasp the complexity of harmonic relationships in jazz.
Best,
Carlos
Interesting comment, Carlos. I know my way around jazz chords on the keyboard, but I never got around to learning jazz chords properly on the guitar. (I started a few times, but the guitar kept returning to the cupboard for a while!) I suspect that remembering chord positions on the guitar is harder than on the piano, but on the piano too, there are certain chord ‘positions’ that play a different role depending on the musical context — especially the bass note, for example.
I suspect that learning these chord positions is just like learning a language in which some words have different meanings depending on their context (like the bark of a dog and the bark on a tree, for example). Eventually it becomes automatic. But yes, I think you could visualise these relationships somehow.
Of course, it also helps to know the theory underpinning the chords, and I find that much easier on the piano!