Most of the cool kids in communication and cultural studies these days are studying social media. Fake news on Facebook, Russian bots on Twitter, maladjusted manboys on Reddit — these are the kinds of research topics that are likely to score you a spot in one of the popular sessions at that big conference that everyone will be going to this year. And for the most part, rightly so, since these platforms have become an integral component of the networked public sphere in which popular culture and political discourse now unfold.
But lurking at the back of the conference programme, in the Friday afternoon sessions when the cool kids have already left for the pub or the airport, you might find some old-timers and young misfits who, for one reason or another, continue to study more traditional, less sexy forms of media. Like newspapers, for example. Or television news. Not so long ago, these were the go-to sources of data if you wanted to make claims about the state of public discourse or the public sphere.

Never one to follow the cool kids, I structured my whole PhD around a dataset comprising around 24,000 newspaper articles supplemented with texts from similarly uncool sources like media releases and web pages. One reason for choosing this kind of data is that it enabled me to construct a rich timeline of an issue (coal seam gas development in Australia) that reached back to a time before Twitter and Facebook even existed (member?). Another reason is that long-form texts provided good fodder for the computational methods I was interested in exploring. Topic models tends to work best when applied to texts that are much longer than 140 characters, or even the 280 that Twitter now allows. And even if you are interested primarily in social media, mainstream media can be hard to ignore, because it provides so much of the content that people share and react to on social media anyway.
So there are in fact plenty of reasons why you might still want to study texts from newspapers or news websites in the age of social media. But if you want to keep up with your trending colleagues who boast about their datasets of millions of tweets or Facebook posts assembled through the use of official platform APIs (member?), you might be in for some disappointment. Because while news texts also exist in their millions, sometimes even within single consolidated databases, you will rarely find them offered for download in large quantities or in formats that are amenable to computational analyses. The data is all there, but it is effectively just out of reach.
I, Robot
Take Factiva, for example. Run by Dow Jones, Factiva catalogues the full text of more than 32,000 news sources from around the world, including most major newspapers and many smaller publications, in many cases going back several years, or even decades. I know about Factiva because my library subscribes to it, and because I used it to obtain the news articles that I analysed in my PhD. Its search facility is surprisingly efficient. Mere seconds after submitting a search query for ‘coal seam gas’ and related terms in Australian media over the last 20 years, I was presented with a list of more than 40,000 relevant news articles, all with full text available.
Awesome! 40,000 articles! Where’s the download button?
And then you realise that there isn’t one. Or rather, there is, but it only allows you to download one page of results (that’s 100 articles) at a time, and only in a consolidated HTML file. So, not only will you have to load and save 400 separate pages of search results to retrieve all 40,000 articles, but at the end of it, you won’t even have the data in a format that text analysis packages in R or Python or Knime can readily work with.
But it gets worse, because it turns out that you can only save a one or two pages in a session before you start getting hit with increasingly onerous Captcha tests asking you to prove that you are not a robot. Ironically enough, I don’t think I’ve ever felt more like a robot than I did during a session of mindlessly, mechanically clicking on image after image containing (or not containing) cross-walks, traffic lights, buses, bridges, bicycles or fire hydrants. If driverless cars ever become a reality, it will be thanks in no small part to the training data that I have generated in return for full-text Factiva outputs.
Having finally downloaded all of these 40,000 texts, I was only able to use them in my PhD because someone else had written an online tool that converted the HTML outputs into tables in CSV format, separating out each individual text along with vital metadata such as the title and date of publication. This tool still left me with 400 CSV files to stitch together, but that, at least, was within my capabilities at the time.
In recent months, I’ve turned once more to Factiva as a source of data for a large-scale media analysis. It turns out that since I assembled my PhD dataset, the format of Factiva’s outputs has changed, so the tool I used previously to parse them into CSV files no longer works. Somewhat more confident now in my data manipulation abilities, I decided to have a crack at creating my own tool for teasing apart the components of Factiva’s HTML outputs and assembling them into a machine-readable table.
Ladies and gentlemen, I give you… Facteaser!
Introducing Facteaser
It’s a terrible name, I know. Maybe just terrible enough to be remembered until Factiva changes its outputs again and it no longer works. It parses Factiva outputs by splitting the HTML files into rows and classifying the rows based on their content (does it look like a date? a title?) and their position relative to the start of each article (which in turn is determined with reference to other recurring features).
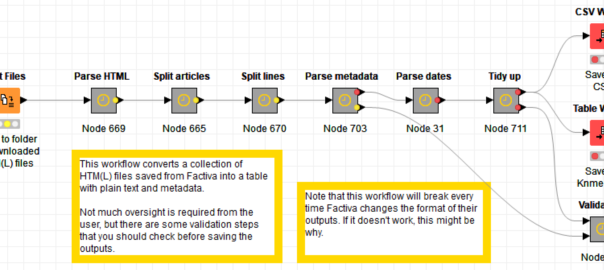
If you read my last post, you won’t be surprised to learn that I’ve created this parsing tool as a workflow in Knime, the only programming ‘language’ in which I am proficient. To use this workflow, you will have to install Knime and download the workflow from my Github page. When you load it, you will see something like this:
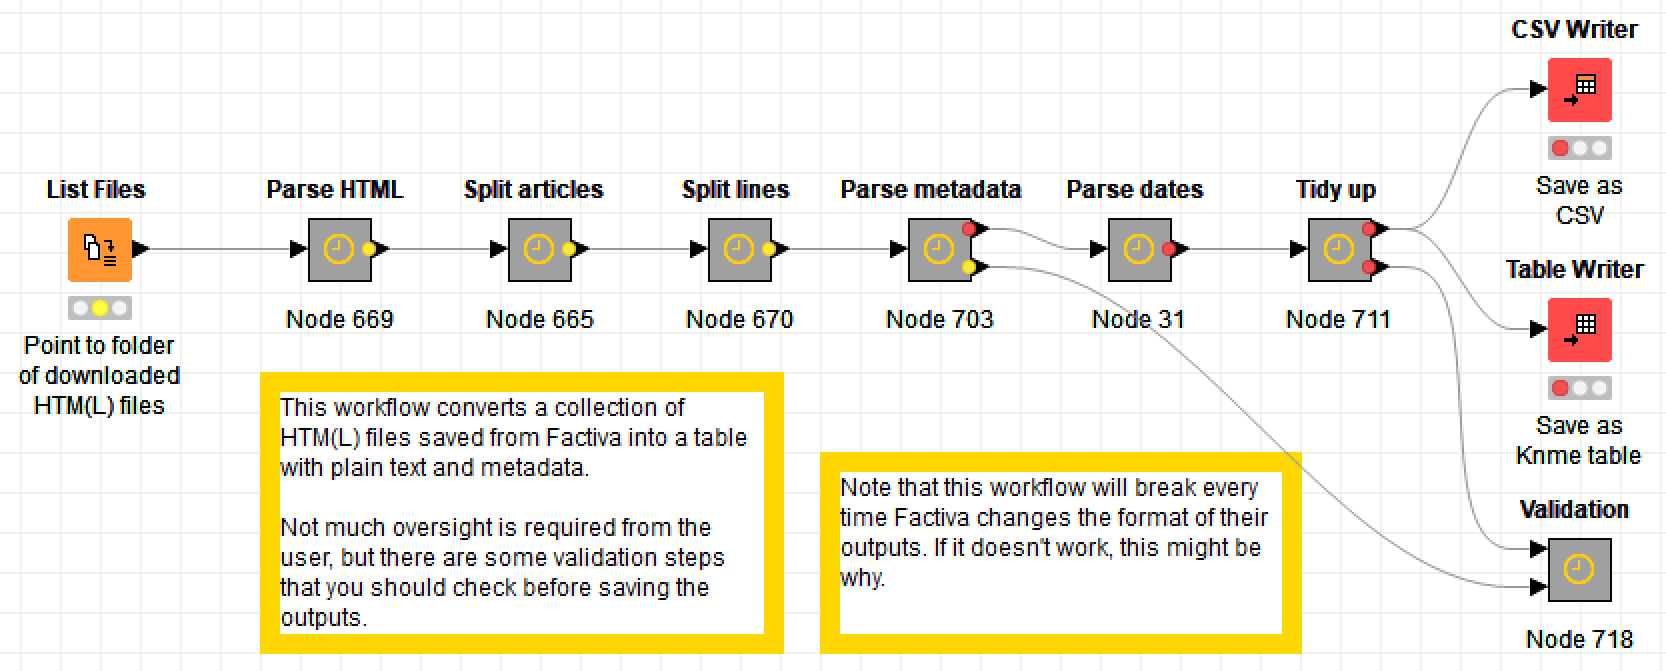
You don’t have to do much more than point the first node to the folder containing your saved Factiva outputs, and then wait for the workflow to churn through them. Note that if you give the workflow thousands of articles to churn through, this process could take several minutes. Make a cup of tea. Once it’s finished, you can save the outputs as a CSV file or as a table in Knime’s native format.
That’s how it should work in theory. In practice, things might still go wrong, so I’d urge you to poke around inside the metanodes to see what is going on and to inspect the interim outputs. In particular, check the Validation metanode to see if crucial metadata such as dates and source names are not being parsed.
As I’ve alluded to already, this workflow will only work until Factiva decides to change the format of its outputs once again (which they probably do periodically just to annoy people like me). When that happens, the workflow may need minor adjustments, or it might need major surgery. In the latter case, I can’t guarantee that I’ll get around to fixing it. So if you want to take advantage of this workflow, you might want to do it sooner rather than later.
The elephant in the room
So far in this post, I’ve ignored a rather important question about this whole exercise — namely, should we be downloading Factiva outputs in such large quantities at all? And should I be enabling people to do it? Clearly, Factiva doesn’t want us to be doing this. If they did, they would make it easier to do. Their reluctance to provide large chunks of their dataset in a machine-readable format is understandable. Having the data in this format is what makes their product valuable, and giving it away in this state could potentially enable people to recreate Factiva’s functionality and bypass their service. On top of that, much of the news content that Factiva hosts would otherwise need to be obtained through paid subscriptions, so providing large amounts of it to individual users may not be acceptable to the outlets that created the content.
On the other hand, I think that services like Factiva need to accept that it isn’t 1995 anymore. (Ok, so Factiva wasn’t even founded until 1999, but somehow 1995 just sounds better in a jibe like this.) Researchers, journalists, and other analysts can now work with textual data in ways that they couldn’t before, and will keep looking for ways to obtain such data in bulk rather than in bits and pieces. Given the opportunity, such users might even be willing to pay a premium for the privilege, or to work within reasonable limits, just as they do with the Twitter API, for example. After all, few researchers are ever going to want to download all of Factiva, or even all of a given newspaper. More typically, researchers will only want articles relating to a certain topic, and published within a certain timeframe. Datasets of this kind could hardly be used to undercut the service that Factiva provides.
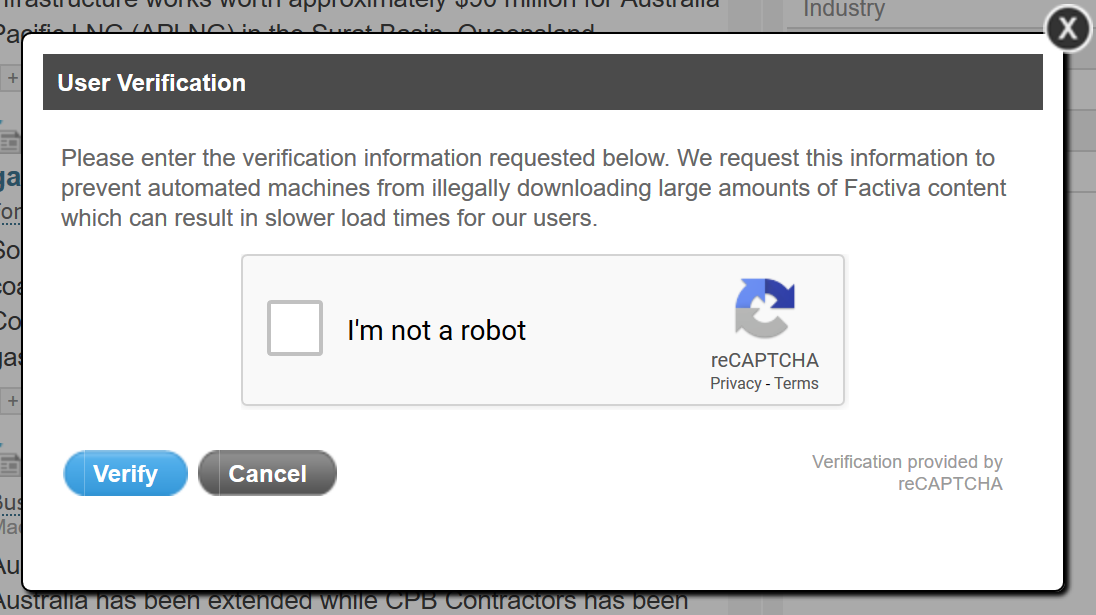
Or perhaps, as Factiva’s pop-up message suggests, restricting such downloads is also a matter of resources: if everyone tried to download Factiva’s data en masse, Factiva’s servers might grind to a halt. To which I say again, it isn’t 1995 anymore: if your infrastructure can’t cater to your users’ needs, maybe it’s time for an upgrade.
We’ll have to wait and see whether providers like Factiva ever decide to accommodate users who want to analyse textual data in bulk rather than working with it the old-fashioned way. If the examples being set by social media platforms like Twitter and Facebook — who are reducing, rather than increasing, the amount of data that researchers can obtain — are anything to go by, the chances do not look great. For the foreseeable future, hacks like Facteaser might be the only viable way to enable this kind of analysis.
On the bright side, 1995 wasn’t such a bad year. Member?